|
|
|
|
|
|
2009 Usage by Energy Source
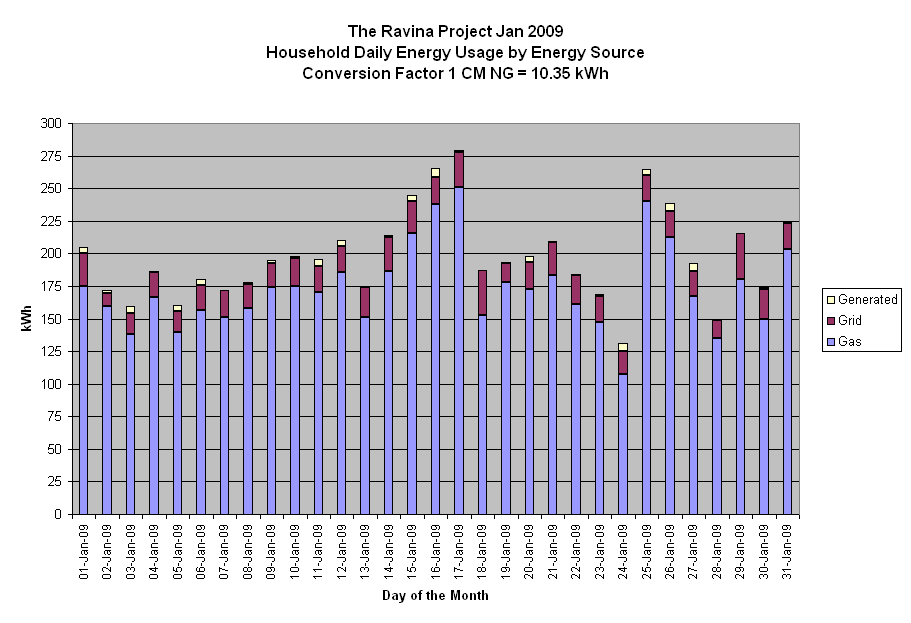
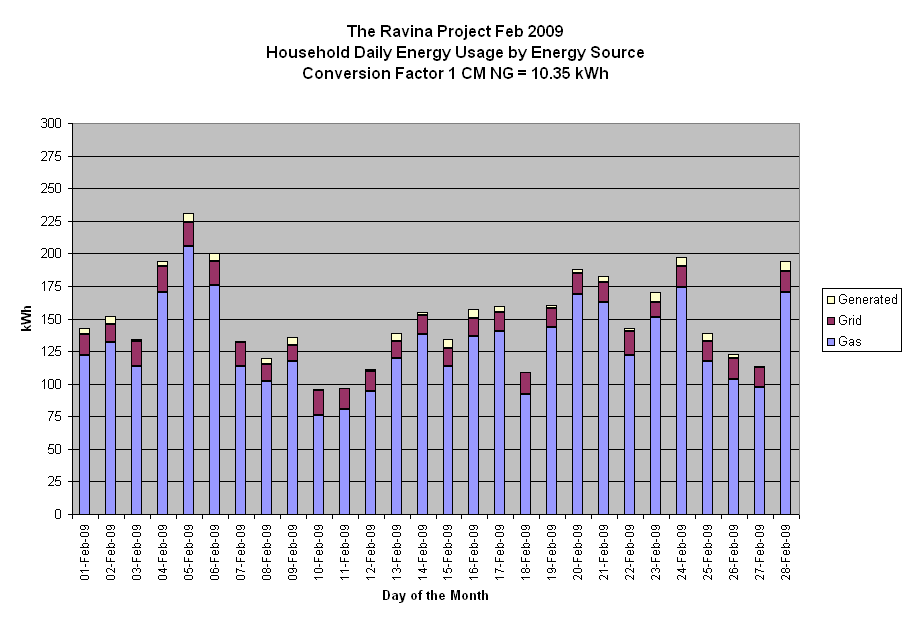
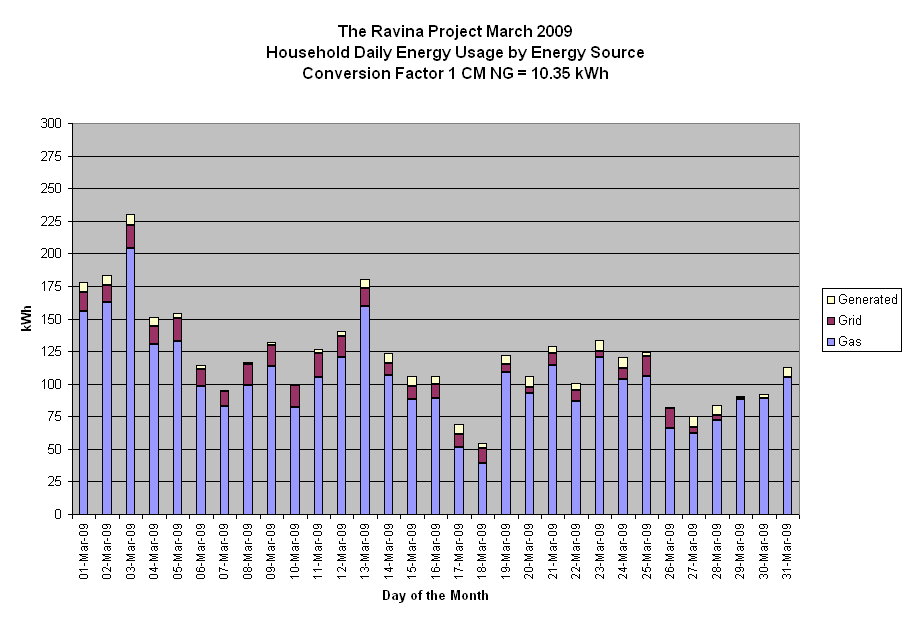
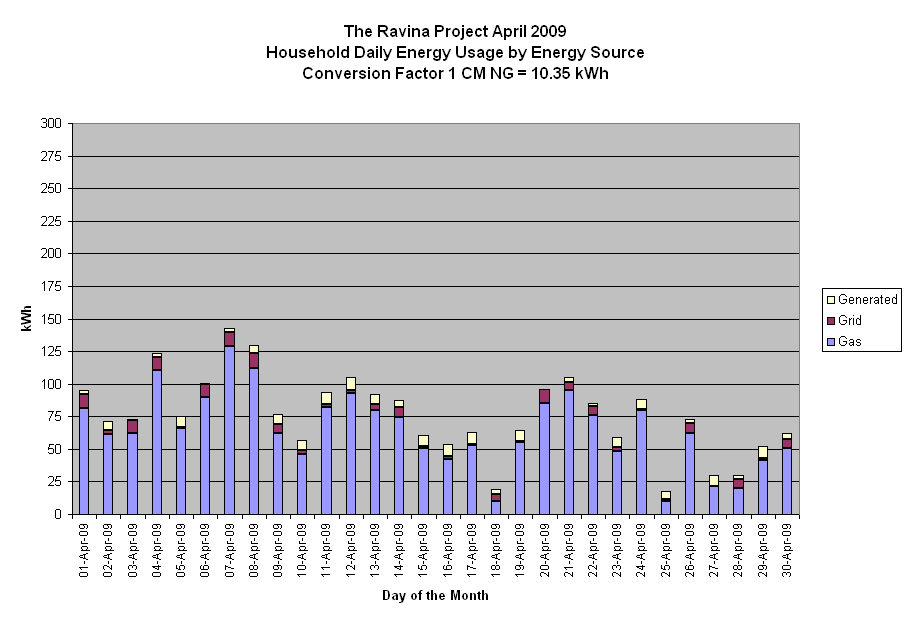
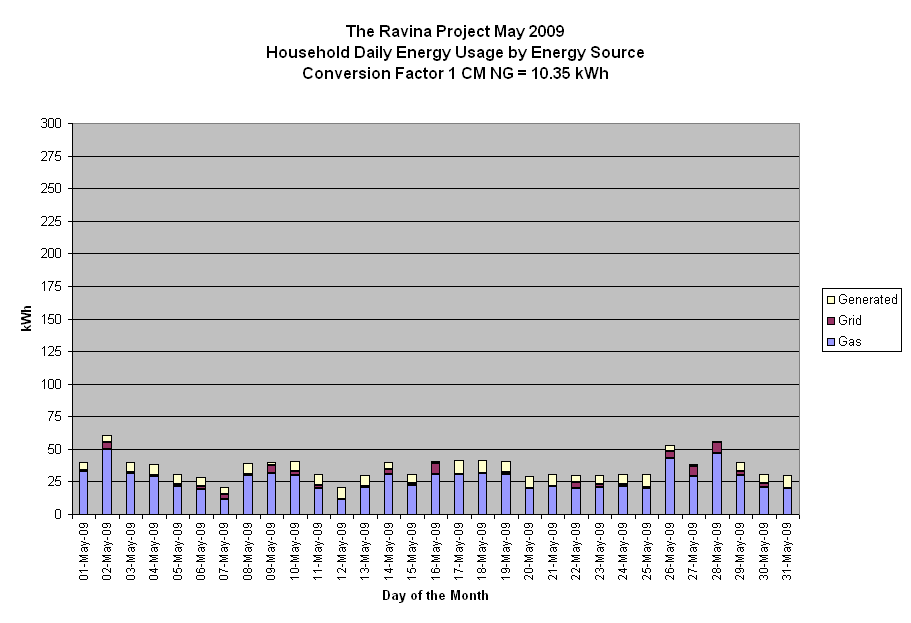
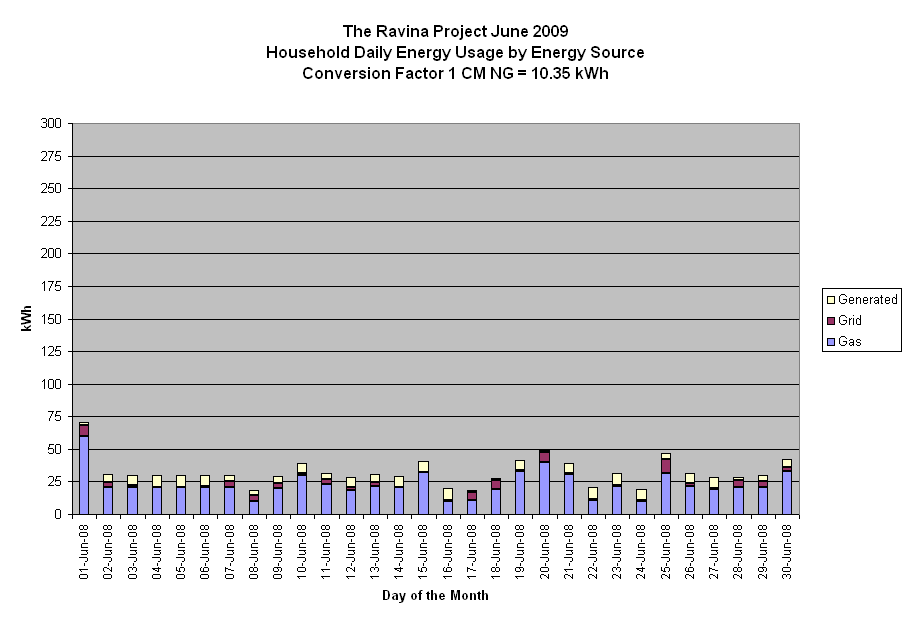
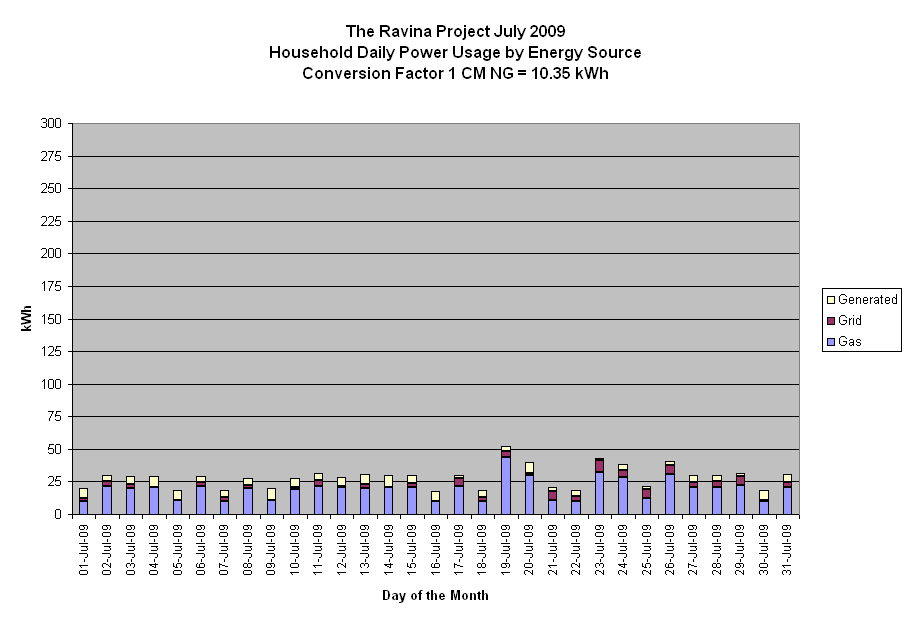
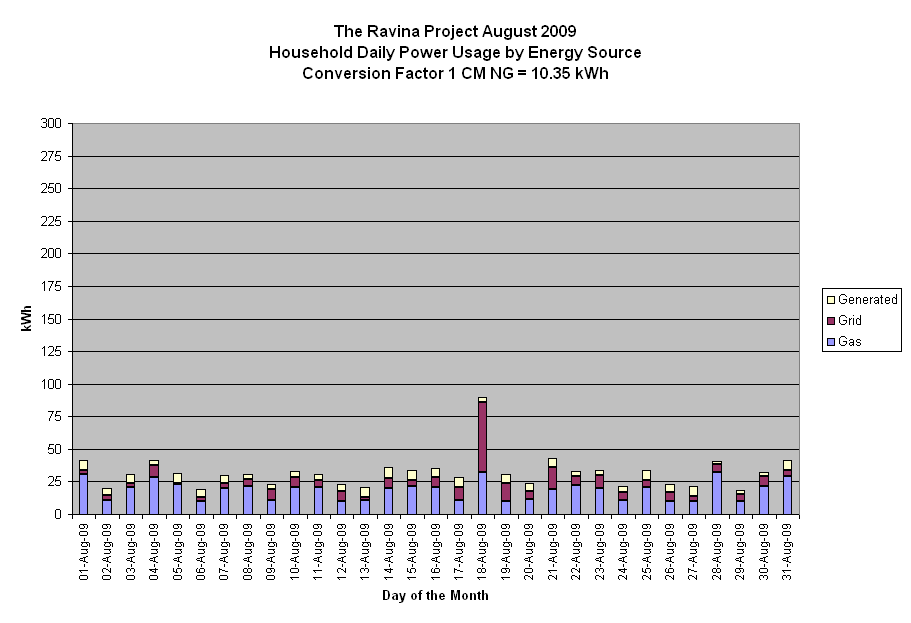
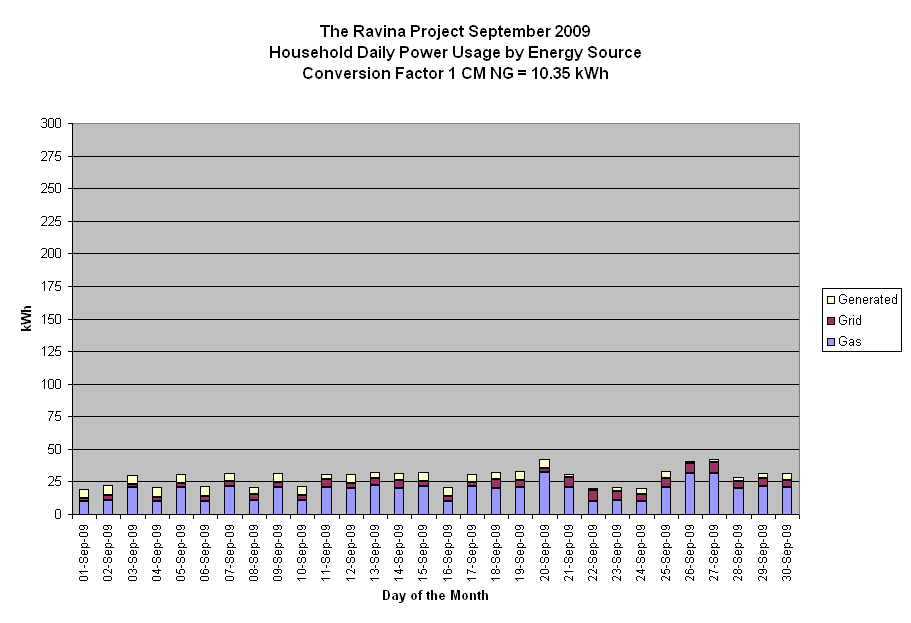
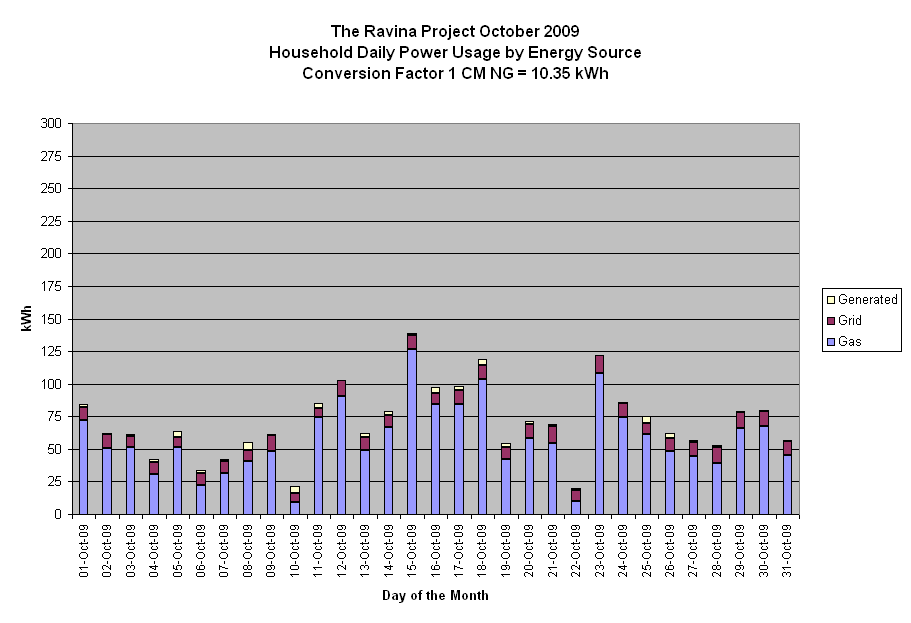
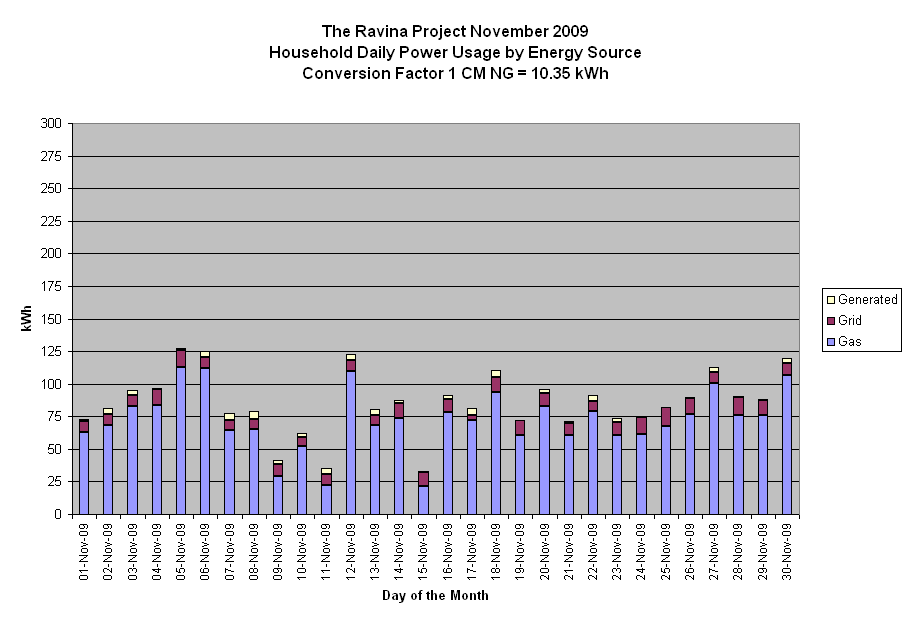
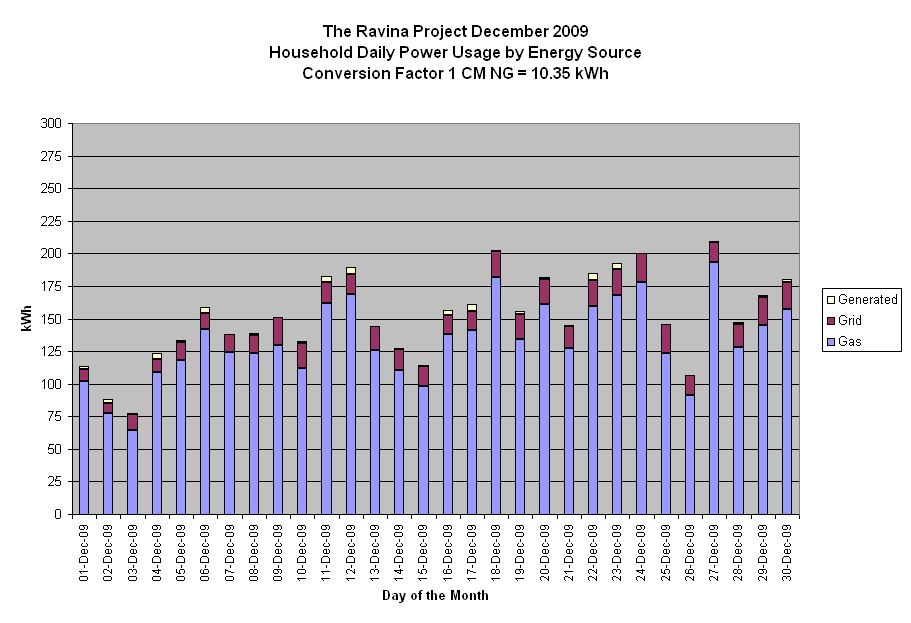
This series of graphs represents one of several household thermodynamic tracking projects that are being conducted at The Ravina Project. These data are collected every day from the utility meters. For the purposes of these graphs the power used from all sources is converted to kilowatt hours (kWh). This allows for a direct comparison of the household usage among energy sources.
The following graphs track household power usage by energy source. Inputs are broken out by three sources: gas, grid and generated. The total length of the bar above zero represents the total amount of power used by the household on that day expressed in kWh.
