|
|
|
|
|
|
|
|
|
|
House Data
The Ravina Project is tracking several household parameters including power inputs. Our house has three energy inputs available to it. We use NG natural gas for several appliances including our stove, dryer and boiler. We use electrical power from both the grid and the solar array.
On the House Data pages we will use graphs to present a picture of our household thermodynamics. The Electric Usage page tracks our use of electrical power. The Gas Usage page tracks out use of NG.
What is the total daily energy usage for our house from all sources? It seems like a simple question until one realizes that the inputs, NG and electricity are expressed in incompatible units. Luckily, we found a conversion between them. We use a conversion factor of 10.35 kWh per cubic meter of natural gas. Our graphs present the total usage of the house in kWh. See the House Thermo1 page for a look at the heat flow in our house broken out by energy source for each day of the year.
How efficient is our house? Can we see the results of changes we make to our house by seeing a change in house heating efficiency? You can make the same calculations for your house too! See the HDD Calculate page for more information.
See our papers on Household Thermodynamics, on the Project Papers page for more background and detail on what we have done for winter time heating and efficiencies.
Here are a few newer charts using our years of data.
Natural Gas used for heating
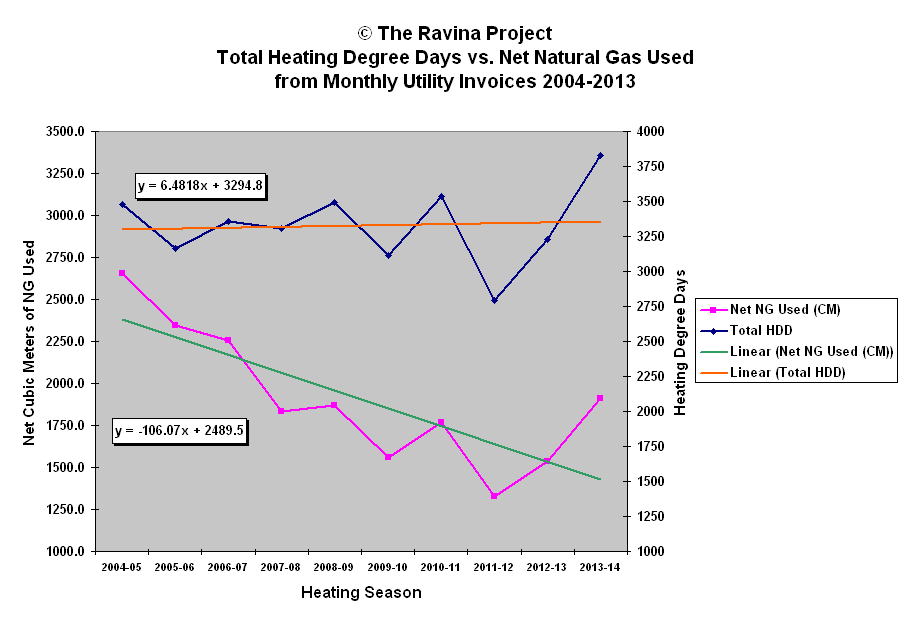
The chart directly below is busy so I want to unpack it for you.
Over ten heating seasons we have kept all our Natural Gas Utility invoices. We also have taken the data from the local environment Canada weather station (our Tax Dollars at work). From the weather data, we used the daily 24-hour average temperature as a base and calculated for each day the number of Heating Degree Days that can be assigned to that day. See our HDD Calculate page for more info.
We subtract from each wintertime monthly gas total the summertime gas usage. This subtracts the non-heating usage of NG from each winter month and gives us the Net NG monthly usage for heating.
The chart below compares the usage of net natural gas with the number of heating degree days. The more heating degree days in a season means the season was colder.
Now that you have an idea of how the chart works, let's look closely at it. If we look at the blue line, its daily value is positive only if the daily average temperature is below 18 degrees centigrade. So that means as this seasonal value increases the colder it is. We see the linear trend is basically flat (very slightly positive). So on average over the 10 years we have experienced about the same amount of cold.
The pink line traces the amount of NG used to heat the house. The green line is the linear trend of the NG we have used. It is strongly negative. Even as the average winter time temperature over 10 years stays the same, the amount of natural gas we use to heat the house falls dramatically.
The only difference from season to season is insulation, new windows, better heat flow inside the house using curtains, a digital thermostat and the mindfulness of leveraging all heat and humidity production into making the wintertime house comfortable.

Household Efficiency
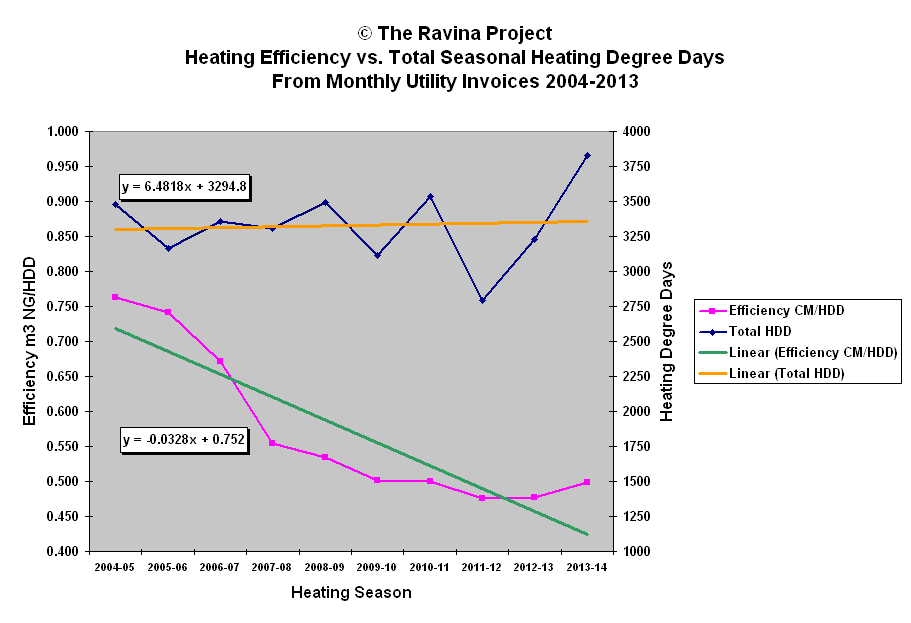
The chart below looks at our household over the same 10 years but calculates the actual efficiency of the household each heating season.
The blue line remains the same as the above chart.
The pink line represents the calculated efficiency in cubic meters of NG used for every Heating Degree Day (m3 NG/HDD). Left unmodified the household will respond the same way to changes in seasonal Heating Degree Days (HDD). The efficiency will track the number of HDD, that is, a similar number of HDDs will produce a similar efficiency number. This means the household exhibits the same impedance to heat leaking out of the house year after year.
What we see is a dramatic improvement in household efficiency. So from 2004-05 to 2008-09 the number of heating Degree Days is about the same with minor deviations. But if we look at the household efficiency we see a dramatic drop. Over the course of 10 years of wintertime our work at making the household more efficient has, according to the numbers, paid off. Notice the spike in HDDs from the warm 2011-12 season to the cold 2013-14 and how little the efficiency responded to that change. That demonstrates that the insulation and household changes are working to impede the flow of heat from inside the house to outside by the same amount no matter how cold it is.
This reinforces what we have learned about energy usage. In the areas of the world that require fossil fuels for winter time heating, the greatest impact a household can have upon humanity's decarbonization project is to insulate, modify house internal heat flow and change household behaviour.

