|
|
|
|
House Efficiency Calculation using
Heating Degree Days
This graph represents one of several household thermodynamic tracking projects that are being conducted at The Ravina Project. We are interested in tracking the heating efficiency of our house as we make various changes both to the house operation and to the insulation. Are we getting better? That's always the question.
Heating Degree days are calculated by subtracting the average temperature for the day from a standard temperature. The difference is the number of heating degree days generated by that particular day. On that day the house uses some number of cubic meters of natural gas. Once these values are known then one can calculate the thermal efficiency of the house.
We can define the thermal efficiency of the house by answering the following question. How well does my home retain heat? Since heat flows only in one direction, from hotter to colder, then the question really becomes, how well does my house's physical structure and its operation impede the flow of heat through it. The perfectly insulated house would have no heat flowing through it ... the heat would be stopped at some point, never travel farther and certainly not reach the outside.
We do not live in perfectly insulated houses. Heat will escape the house when the outside temperature is lower than that inside. Since the house is heated by natural gas, the amount of natural gas used should be proportional, in the winter time, to the amount of heat escaping the house. The relationship should be close to this: the greater the heat leakage, the greater the amount of natural gas used to keep the house within a certain temperature range.
Heating Degree Days allow us to make a standardized comparison among houses' structural insulation efficiencies. It does this by fixing the temperature inside the house at 18 degrees centigrade. If the outside temperature is 18 degrees centigrade then, using this model, no heat flow occurs from inside the house to the outside world. As the difference in temperature increases, the greater the flow of heat because there is a greater heat flow pressure between the hotter areas and the colder areas. Simply put, as the difference between inside temperature and outside temperature increases the greater the pressure driving heat through the walls of the house. As heat is lost, natural gas is burned to keep the house within a desired range of internal temperatures. The greater the number of heating degree days; the greater the number of cubic meters of natural gas used. We can calculate a ratio as follows: 'the number of cubic meters of gas used' divided by 'the number of degree days'. This will give us the number of cubic meters of gas used for every heating degree day.
All good stuff so far however, how does one separate out the gas burned to heat the house from the gas used for preparing food, drying clothes and heating water? Good question! We summed the total gas used during the warm months from June to September each year. For each of these totals we divide by the total number of days in those four months. We came out with a number of cubic meters of natural gas used each day. That daily use, net any use for heating, became a baseline use number for the next heating season. On the efficiency analysis spreadsheet below the entry Net NG Used (CM) signifies the gas used less the baseline usage. This is as close as we can get to a number that represents the use devoted to heating the house. Note we use the previous summer's baseline calculation. See how our baseline has changed over the years. One adult was added to the household in the Fall of 2005 and you can see the change in the baseline calculation for the next Summer. This presented a problem which we have recently discovered. There is no previous Summertime baseline calculation for this new person. The previous Summer's baseline reflects Natural Gas usage for only one person. What we have done to correct this problem is to use the baseline calculation (from the Summer of 2006) of 1.89 CM/Day for BOTH these sets of Winter months. The net effect is that the Winter of '05-'06 shows less net cubic meters of gas used and hence a slight increase in the efficiency of the household. We believe that this new number more accurately reflects the household efficiency for the Winter of '05-'06.
Notice that the baseline usage increased to 2.28 CM/day for this past Summer ('10). Another adult was added to the household. More gas was used for personal hygiene, cooking, clothes drying when it was raining for long periods and the like.
Here's an example of a calculation. House A uses net 300 cubic meters of gas in a month. The total number of heating degree days for the month is also 300. House A uses (300 cubic meters / 300 heating degree days) = 1 cubic meters of gas per heating degree day.
Notice that if the net number of cubic meters of gas used increases while the number of heating degree days remains the same value, the resulting ratio changes from 1 (one) to a value greater than one. For instance, consider House B. Its numbers are: '600 net cubic meters of gas used' / '300 heating degree days' = 2. We see that House B used two (2) cubic meters of gas whereas house A above used only one (1) per heating degree day. The House B must be less efficient than House A.
Heating degree days may be available from a weather office near you. We use the stats for "Toronto Center" from Environment Canada. See our new paper on Household Thermodynamics October 2011 on the Project Papers page detailing all the changes we made to the house over several winters.
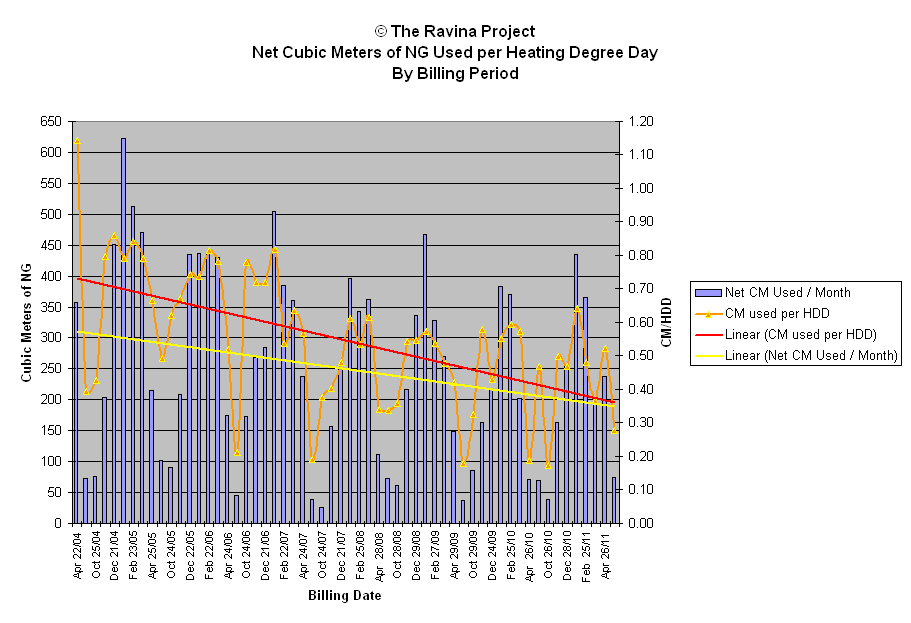
Here's our Graph and Data for the last several years of natural gas usage and heating degree days.
Note that the number of days varies because the dates are defined by billing periods and not by a simple calendar.
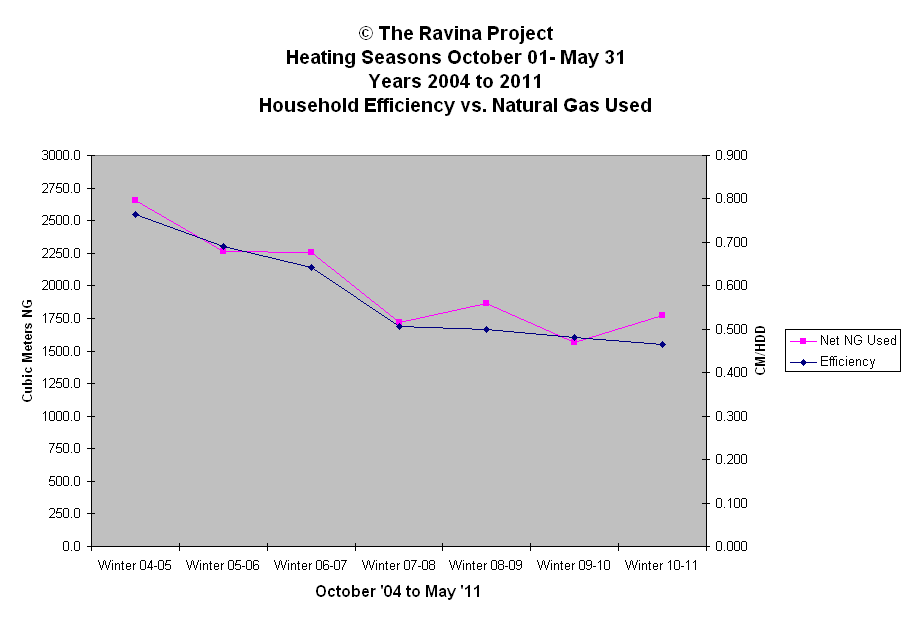
Efficiency Analysis Using Previous Summer's Baseline Winter 04-05 Winter 05-06 Winter 06-07 Winter 07-08 Winter 08-09 Winter 09-10 Oct/04 - May/05 Oct/05 - May/06 Oct/06 - May/07 Oct/07 - May/08 Oct/08 - May/09 Oct/09 - May/10 Total NG Used (CM) 3024 2724 2710 2154.6 2330 2032 Total Baseline Used (CM) 369.0 462.2 455.4 436.4 463.7 470.1 Net NG Used (CM) 2655.0 2261.8 2254.6 1718.2 1866.3 1561.9 Total HDD 3478.5 3277.7 3507.3 3400.3 3736.4 3242.4 Efficiency CM/HDD 0.763 0.690 0.643 0.505 0.499 0.482 Year over year % increase 9.59 6.84 21.40 1.15 3.56 % increase over baseline 9.59 15.78 33.80 34.56 36.89 Winter 10-11 Oct/10 - May/11 Total NG Used (CM) 2328 Total Baseline Used (CM) 559.2 Net NG Used (CM) 1768.8 Total HDD 3804.2 Efficiency CM/HDD 0.465 Year over year % increase 3.47 % increase over baseline 39.08
Baseline Calculation Baseline calc for June through September 2004 days= 121 CM NG used 183 Baseline 1.51 CM/day Baseline calc for June through September 2005 days= 121 CM NG used 187 Baseline 1.55 CM/day Baseline calc for June through September 2006 days= 123 CM NG used 233 Baseline 1.89 CM/day Baseline calc for June through September 2007 days= 123 CM NG used 220 Baseline 1.79 CM/day Baseline calc for June through September 2008 days= 121 CM NG used 229 Baseline 1.89 CM/day Baseline calc for June through September 2009 days= 121 CM NG used 239 Baseline 1.98 CM/day Baseline calc for June through September 2010 days= 124 CM NG used 283 Baseline 2.28 CM/day


