|
|
|
|
Solar Data April 2011
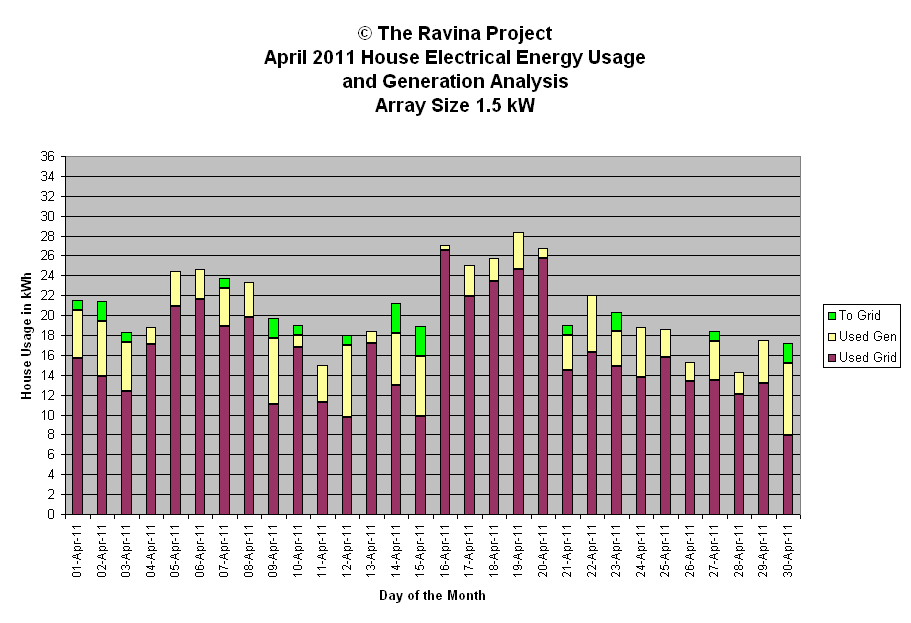
This page contains both generation data and a graph for the month.
Used Gen and Used Grid amounts in the chart show electrical energy used by the household from the solar array and the grid respectively. The To Grid amount represents the energy pushed back to the grid and not used by the household.
| April 2011 Power Generation Analysis | © The Ravina Project | ||||||||
| Day | kWh | Weather | Peak | Minutes | Efficiency | Array Size | 1.5 | kW | |
| Gen | Watts | Wh/min/kW | |||||||
| 1-Apr-11 | 5.8 | oc/diff am pt cld pm | 1427 | 765 | 5.1 | Generation Analysis kWh | |||
| 2-Apr-11 | 7.6 | sun am, pt cld pm | 1355 | 769 | 6.6 | ||||
| 3-Apr-11 | 6.0 | sun am, pt cld oc pm | 1111 | 772 | 5.2 | Total | 134.1 | ||
| 4-Apr-11 | 1.8 | diff am, oc pm | 1104 | 774 | 1.6 | Average | 4.5 | ||
| 5-Apr-11 | 3.5 | oc am, pt sun pm | 1753 | 777 | 3.0 | Median | 4.0 | ||
| 6-Apr-11 | 3.0 | thin cld / oc | 915 | 780 | 2.6 | Stdev | 2.5 | ||
| 7-Apr-11 | 4.9 | oc am, sun pm | 1425 | 784 | 4.2 | ||||
| 8-Apr-11 | 3.5 | oc am, pt sun late pm | 861 | 786 | 3.0 | WX short forms used | |||
| 9-Apr-11 | 8.6 | sun | 1192 | 789 | 7.3 | ||||
| 10-Apr-11 | 2.2 | oc am, thn cld pm | 818 | 792 | 1.9 | oc - overcast | |||
| 11-Apr-11 | 3.7 | oc early am, thn cld pm | 1284 | 795 | 3.1 | diff - diffuse light | |||
| 12-Apr-11 | 8.2 | sun / thn cld | 1301 | 798 | 6.9 | brks - breaks | |||
| 13-Apr-11 | 1.2 | oc | 378 | 801 | 1.0 | br - bright | |||
| 14-Apr-11 | 8.2 | sun thn cld am | 1561 | 804 | 6.8 | cld - cloud | |||
| 15-Apr-11 | 9.1 | sun thin cld am | 1288 | 806 | 7.5 | hi - high altitude | |||
| 16-Apr-11 | 0.5 | oc rain wind | 263 | 809 | 0.4 | hz - haze pollution or cirrus | |||
| 17-Apr-11 | 3.1 | oc diffuse sun brks | 1479 | 813 | 2.5 | pds - periods | |||
| 18-Apr-11 | 2.3 | oc sun late pm | 391 | 815 | 1.9 | pt - part | |||
| 19-Apr-11 | 3.7 | sun am oc pm cold | 1523 | 818 | 3.0 | wx - weather | |||
| 20-Apr-11 | 1.1 | oc dull / diffuse | 532 | 821 | 0.9 | sml - small | |||
| 21-Apr-11 | 4.5 | sun cld cool | 1706 | 823 | 3.6 | mod - moderate | |||
| 22-Apr-11 | 5.7 | thn cld | 1572 | 827 | 4.6 | ||||
| 23-Apr-11 | 5.5 | sun cld pm | 1312 | 829 | 4.4 | Peak Watt Analysis W | |||
| 24-Apr-11 | 5.0 | oc am sun pm | 1295 | 832 | 4.0 | ||||
| 25-Apr-11 | 2.8 | sun am, cld rain pm | 1147 | 834 | 2.2 | Maximum | 1753 | ||
| 26-Apr-11 | 1.9 | oc rain | 1233 | 837 | 1.5 | Minimum | 263 | ||
| 27-Apr-11 | 4.9 | sun / rain / sun | 1315 | 840 | 3.9 | Average | 1200 | ||
| 28-Apr-11 | 2.2 | oc sunny brks | 1581 | 843 | 1.7 | Median | 1292 | ||
| 29-Apr-11 | 4.3 | oc / diff sunny brk | 1695 | 845 | 3.4 | Std deviation | 399 | ||
| 30-Apr-11 | 9.3 | sun thn cld am | 1194 | 848 | 7.3 | ||||
| Efficiency Analysis Wh/min/kW | |||||||||
| Monthly: | 134.1 | 24226 | |||||||
| YTD: | 421.6 | Maximum | 7.5 | ||||||
| Minimum | 0.4 | ||||||||
| Average | 3.7 | ||||||||
| Median | 3.2 | ||||||||
| Std Deviation | 2.1 | ||||||||

