|
|
|
|
Solar Data January 2011
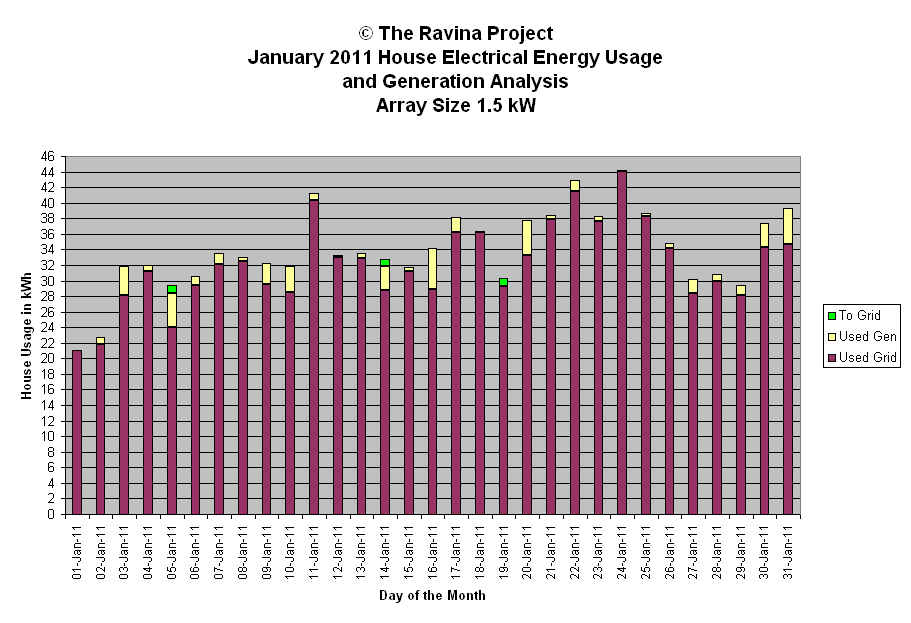
This page contains both generation data and a graph for the month.
Used Gen and Used Grid amounts in the chart show electrical energy used by the household from the solar array and the grid respectively. The To Grid amount represents the energy pushed back to the grid and not used by the household.
| January 2011 Power Generation Analysis | © The Ravina Project 2011 | ||||||||
| Day | kWh | Weather | Peak | Minutes | Efficiency | Array Size | 1.5 | kW | |
| Gen | Watts | Wh/min/kW | |||||||
| 01-Jan-11 | 0.0 | oc very dull | 38 | 540 | 0.0 | Generation Analysis kWh | |||
| 02-Jan-11 | 0.8 | oc cld sunny brks | 1194 | 541 | 1.0 | ||||
| 03-Jan-11 | 3.8 | sun am cld pm | 1344 | 542 | 4.7 | Total | 53.8 | ||
| 04-Jan-11 | 0.7 | oc diff | 647 | 543 | 0.9 | Average | 1.7 | ||
| 05-Jan-11 | 5.4 | pt cld am | 1302 | 544 | 6.6 | Median | 0.9 | ||
| 06-Jan-11 | 1.1 | sun am oc snow pm | 806 | 545 | 1.3 | Stdev | 1.7 | ||
| 07-Jan-11 | 1.3 | oc sun brks | 894 | 546 | 1.6 | ||||
| 08-Jan-11 | 0.5 | oc br diff | 287 | 547 | 0.6 | WX short forms used | |||
| 09-Jan-11 | 2.7 | sun thn cld snow on array | 823 | 548 | 3.3 | ||||
| 10-Jan-11 | 3.4 | sun thn cld ice on array | 898 | 550 | 4.1 | oc - overcast | |||
| 11-Jan-11 | 0.9 | sun oc ice on array | 820 | 551 | 1.1 | diff - diffuse light | |||
| 12-Jan-11 | 0.2 | oc snow on array | 115 | 552 | 0.2 | brks - breaks | |||
| 13-Jan-11 | 0.6 | oc diffuse | 367 | 554 | 0.7 | br - bright | |||
| 14-Jan-11 | 4.0 | sun thn cld am cld pm | 1291 | 556 | 4.8 | cld - cloud | |||
| 15-Jan-11 | 0.5 | oc snow | 182 | 558 | 0.6 | hi - high altitude | |||
| 16-Jan-11 | 5.2 | sun thn cld am | 1380 | 559 | 6.2 | hz - haze, pollution or cirrus | |||
| 17-Jan-11 | 1.9 | sun / oc / cld | 1424 | 561 | 2.3 | pds - periods | |||
| 18-Jan-11 | 0.2 | oc | 105 | 562 | 0.2 | pt - part | |||
| 19-Jan-11 | 0.5 | oc | 127 | 565 | 0.6 | wx - weather | |||
| 20-Jan-11 | 4.5 | sun thn cld am oc pm | 1285 | 567 | 5.3 | sml - small | |||
| 21-Jan-11 | 0.5 | oc sun brks snow | 320 | 568 | 0.6 | mod - moderate | |||
| 22-Jan-11 | 1.5 | thn cld am oc pm | 958 | 571 | 1.8 | ||||
| 23-Jan-11 | 0.6 | sun snow on array | 138 | 573 | 0.7 | Peak Watt Analysis W | |||
| 24-Jan-11 | 0.1 | snow on array oc | 132 | 575 | 0.1 | ||||
| 25-Jan-11 | 0.4 | oc | 259 | 578 | 0.5 | Maximum | 1501 | ||
| 26-Jan-11 | 0.6 | oc | 226 | 579 | 0.7 | Minimum | 38 | ||
| 27-Jan-11 | 1.9 | sun am oc pm | 1186 | 581 | 2.2 | Average | 714 | ||
| 28-Jan-11 | 0.9 | oc | 193 | 584 | 1.0 | Median | 806 | ||
| 29-Jan-11 | 1.4 | oc am sun pm | 717 | 586 | 1.6 | Std deviation | 498 | ||
| 30-Jan-11 | 3.0 | sun thn cld | 1501 | 588 | 3.4 | ||||
| 31-Jan-11 | 4.7 | sun thn cld | 1166 | 591 | 5.3 | Efficiency Analysis Wh/min/kW | |||
| Maximum | 6.6 | ||||||||
| Minimum | 0.0 | ||||||||
| Average | 2.1 | ||||||||
| Median | 1.1 | ||||||||
| Std Deviation | 2.0 | ||||||||

