|
|
|
|
Solar Data July 2007
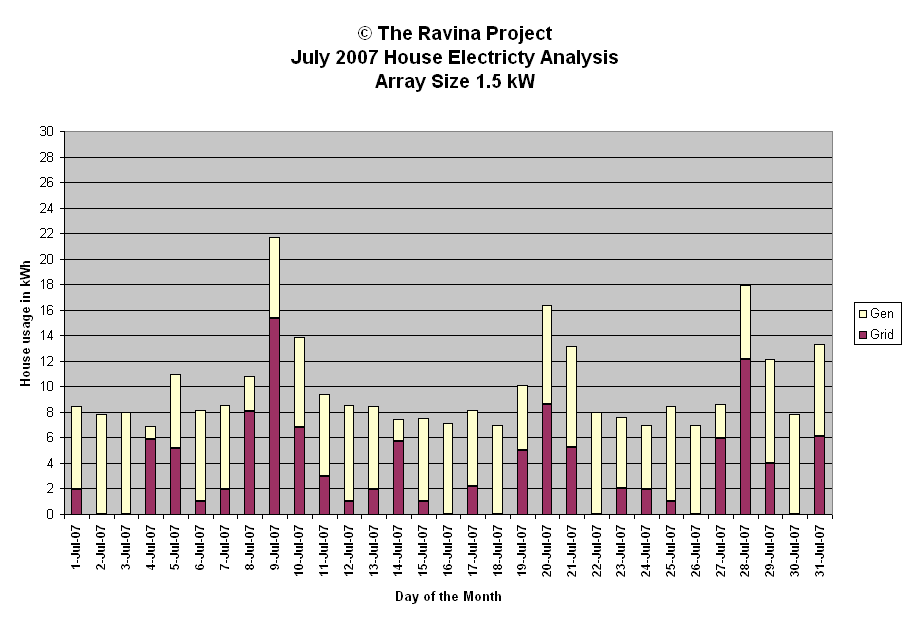
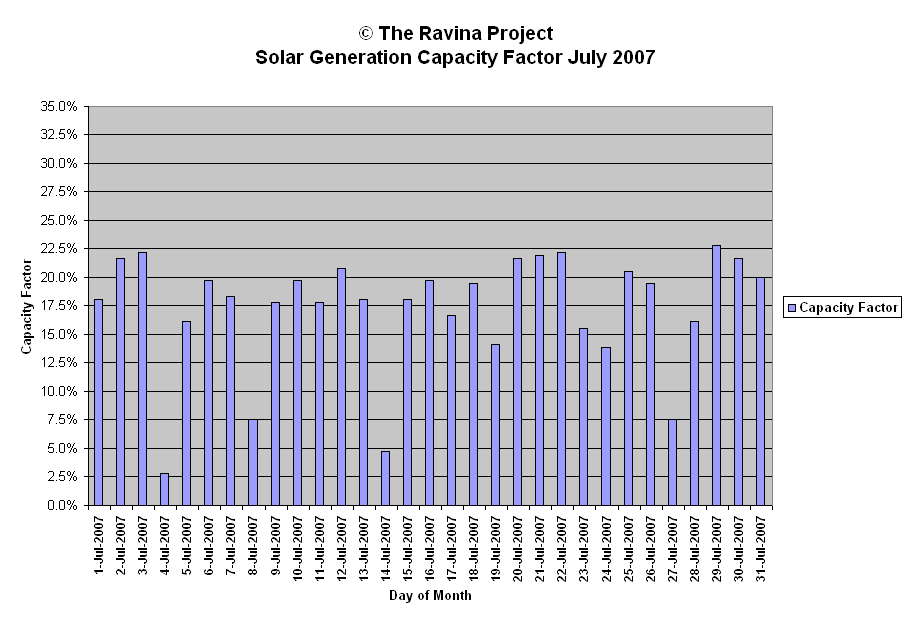
This page contains the daily generation data, a graph of the breakout between generated energy and Grid energy used plus a graphic of the daily Capacity Factor.
| Date | kWh Gen | Weather | Peak | Minutes | Efficiency | Capacity | Array Size | 1.5 | |
| Watts | in Day | Wh/min/kW | Factor | ||||||
| Generation Analysis kWh | |||||||||
| 1-Jul-2007 | 6.5 | sun am cld oc pm late sun | 1601 | 928 | 4.7 | 18.1% | |||
| 2-Jul-2007 | 7.8 | sun am pt sun pm sun late | 1516 | 927 | 5.6 | 21.7% | Total | 193.2 | |
| 3-Jul-2007 | 8.0 | mod hi hz | 1154 | 926 | 5.8 | 22.2% | Maximum | 8.2 | |
| 4-Jul-2007 | 1.0 | oc rain | 274 | 926 | 0.7 | 2.8% | Minimum | 1.0 | |
| 5-Jul-2007 | 5.8 | sun cld rain oc | 1233 | 925 | 4.2 | 16.1% | Average | 6.2 | |
| 6-Jul-2007 | 7.1 | sun am pt sun pm late sun | 1223 | 924 | 5.1 | 19.7% | Median | 6.6 | |
| 7-Jul-2007 | 6.6 | sun am cld pm late sun | 1311 | 923 | 4.8 | 18.3% | Std Deviation | 1.9 | |
| 8-Jul-2007 | 2.7 | rain oc some sun | 1228 | 922 | 2.0 | 7.5% | |||
| 9-Jul-2007 | 6.4 | cld with sun brks | 1102 | 920 | 4.6 | 17.8% | WX short forms used | ||
| 10-Jul-2007 | 7.1 | sun hi mod hz hi clds | 1042 | 920 | 5.1 | 19.7% | |||
| 11-Jul-2007 | 6.4 | sun hi mod hz cld | 1363 | 918 | 4.6 | 17.8% | oc - overcast | ||
| 12-Jul-2007 | 7.5 | sun pt cld | 1370 | 917 | 5.5 | 20.8% | diff - diffuse light | ||
| 13-Jul-2007 | 6.5 | pt cld am pt sun pm | 1639 | 915 | 4.7 | 18.1% | brks - breaks | ||
| 14-Jul-2007 | 1.7 | rain oc some sun | 569 | 914 | 1.2 | 4.7% | SOA - snow on array | ||
| 15-Jul-2007 | 6.5 | pt sun with rain pristine sun | 1390 | 912 | 4.8 | 18.1% | cld - cloud | ||
| 16-Jul-2007 | 7.1 | pt cld hi hz | 1375 | 911 | 5.2 | 19.7% | psun - Pristine Sun | ||
| 17-Jul-2007 | 6.0 | pt cld hi hz | 1321 | 910 | 4.4 | 16.7% | hz - haze, pollution or cirrus | ||
| 18-Jul-2007 | 7.0 | pt cld rain pm | 1112 | 908 | 5.1 | 19.4% | pds - periods | ||
| 19-Jul-2007 | 5.1 | cld sun rain hz | 1229 | 906 | 3.8 | 14.2% | pt - part | ||
| 20-Jul-2007 | 7.8 | pristine sun pt cld | 1463 | 904 | 5.8 | 21.7% | wx - weather | ||
| 21-Jul-2007 | 7.9 | pristine sun pt cld | 1234 | 902 | 5.8 | 21.9% | thn - thin | ||
| 22-Jul-2007 | 8.0 | sun cirrus pt cld | 1215 | 901 | 5.9 | 22.2% | l8r - later | ||
| 23-Jul-2007 | 5.6 | diff sun cld oc | 1247 | 899 | 4.2 | 15.6% | |||
| 24-Jul-2007 | 5.0 | diff sun am oc sun brks pm | 1301 | 897 | 3.7 | 13.9% | Peak Watt Analysis W | ||
| 25-Jul-2007 | 7.4 | sun pt cld | 1171 | 894 | 5.5 | 20.6% | |||
| 26-Jul-2007 | 7.0 | sun hz am oc late pm | 1054 | 893 | 5.2 | 19.4% | Maximum | 1639 | |
| 27-Jul-2007 | 2.7 | oc diff | 630 | 890 | 2.0 | 7.5% | Minimum | 274 | |
| 28-Jul-2007 | 5.8 | sun hz oc | 1050 | 889 | 4.3 | 16.1% | Average | 1178 | |
| 29-Jul-2007 | 8.2 | sun hz | 1022 | 885 | 6.2 | 22.8% | Median | 1228 | |
| 30-Jul-2007 | 7.8 | sun sml hz | 1042 | 884 | 5.9 | 21.7% | Std deviation | 284 | |
| 31-Jul-2007 | 7.2 | sun hz cld | 1040 | 881 | 5.4 | 20.0% | |||
| Efficiency Analysis Wh/min/kW | |||||||||
| Capacity Factor Analysis | |||||||||
| Monthly: | 193.2 | 28171 | Maximum | 6.2 | |||||
| YTD: | 1063.2 | 165628 | Maximum | 22.8% | Minimum | 0.7 | |||
| Minimum | 2.8% | Average | 4.6 | ||||||
| Average | 17.3% | Median | 4.8 | ||||||
| Median | 18.3% | Std Deviation | 1.4 | ||||||
| Std Dev | 5.2% | ||||||||


