|
|
|
|
Solar Data June 2013
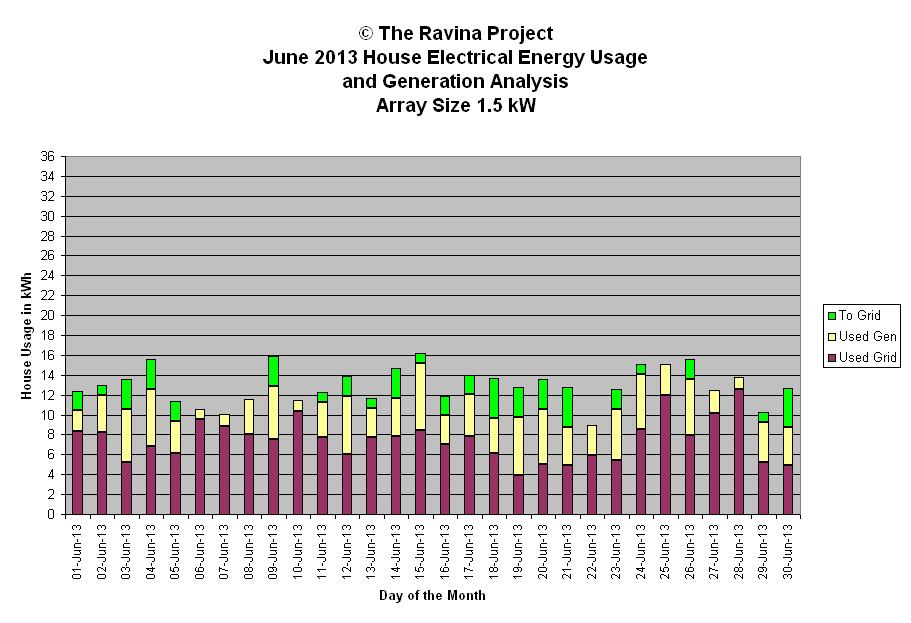
This page contains both generation data and a graph for the month.
Used Gen and Used Grid amounts in the chart show electrical energy used by the household from the solar array and the grid respectively. The To Grid amount represents the energy pushed back to the grid and not used by the household.
| June 2013 Energy Generation Analysis | © The Ravina Project | ||||||||
| Day | kWh | Weather | Peak | Minutes | Efficiency | Array Size | 1.5 | kW | |
| Gen | Watts | Wh/min/kW | |||||||
| 1-Jun-13 | 4.1 | thn cld / cld | 1107 | 915 | 3.0 | Generation Analysis kWh | |||
| 2-Jun-13 | 4.7 | sun cld rain mix | 1309 | 916 | 3.4 | ||||
| 3-Jun-13 | 8.3 | sun cld mix cool | 1298 | 917 | 6.0 | Total | 164.8 | ||
| 4-Jun-13 | 8.8 | pristine sun | 1122 | 918 | 6.4 | Average | 5.5 | ||
| 5-Jun-13 | 5.2 | oc cld AM sun cld mix PM | 1501 | 919 | 3.8 | Median | 5.7 | ||
| 6-Jun-13 | 1.0 | oc dull rain PM | 340 | 921 | 0.7 | Stdev | 2.6 | ||
| 7-Jun-13 | 1.2 | oc dull | 356 | 921 | 0.9 | ||||
| 8-Jun-13 | 3.5 | diff sun AM sun PM | 1438 | 922 | 2.5 | WX short forms used | |||
| 9-Jun-13 | 8.3 | sun cirrus clds | 1039 | 922 | 6.0 | ||||
| 10-Jun-13 | 1.1 | oc rain dull | 290 | 924 | 0.8 | oc - overcast | |||
| 11-Jun-13 | 4.6 | cld AM sun/cld PM | 1446 | 925 | 3.3 | diff - diffuse light | |||
| 12-Jun-13 | 7.9 | sun | 1038 | 925 | 5.7 | brks - breaks | |||
| 13-Jun-13 | 3.9 | oc AM pt sun PM | 1136 | 926 | 2.8 | br - bright | |||
| 14-Jun-13 | 6.9 | oc AM thn cld sun PM | 1136 | 926 | 5.0 | cld - cloud | |||
| 15-Jun-13 | 7.8 | cirrus cld sun | 1094 | 926 | 5.6 | hi - high altitude | |||
| 16-Jun-13 | 4.9 | dull oc rain PM sun/cld PM | 1419 | 927 | 3.5 | hz - haze pollution or cirrus | |||
| 17-Jun-13 | 6.2 | sun cld mix | 1487 | 927 | 4.5 | pds - periods | |||
| 18-Jun-13 | 7.5 | sun pt cld | 1196 | 927 | 5.4 | pt - part | |||
| 19-Jun-13 | 8.8 | sun | 1076 | 928 | 6.3 | wx - weather | |||
| 20-Jun-13 | 8.5 | sun | 1034 | 927 | 6.1 | sml - small | |||
| 21-Jun-13 | 7.8 | cirrus cld sun | 960 | 927 | 5.6 | mod - moderate | |||
| 22-Jun-13 | 3.0 | sun cld rain mix | 1161 | 927 | 2.2 | ||||
| 23-Jun-13 | 7.1 | sun milky blue sky | 937 | 927 | 5.1 | Peak Watt Analysis W | |||
| 24-Jun-13 | 6.5 | sun thn cld cld mix | 1033 | 926 | 4.7 | ||||
| 25-Jun-13 | 3.2 | sun cld rain mix | 1069 | 926 | 2.3 | Maximum | 1501 | ||
| 26-Jun-13 | 7.6 | hot sun thn cld | 979 | 926 | 5.5 | Minimum | 232 | ||
| 27-Jun-13 | 2.3 | oc sun l8r | 308 | 925 | 1.7 | Average | 1027 | ||
| 28-Jun-13 | 1.2 | oc rain | 232 | 925 | 0.9 | Median | 1085 | ||
| 29-Jun-13 | 5.1 | thn cld sun | 973 | 924 | 3.7 | Std deviation | 366 | ||
| 30-Jun-13 | 7.8 | sun thn cld | 1301 | 924 | 5.6 | ||||
| Efficiency Analysis Wh/min/kW | |||||||||
| Monthly: | 164.8 | 27716 | |||||||
| YTD: | 775.5 | Maximum | 6.4 | ||||||
| Minimum | 0.7 | ||||||||
| Average | 4.0 | ||||||||
| Median | 4.1 | ||||||||
| Std Deviation | 1.9 | ||||||||

