|
|
|
|
Solar Data March 2014
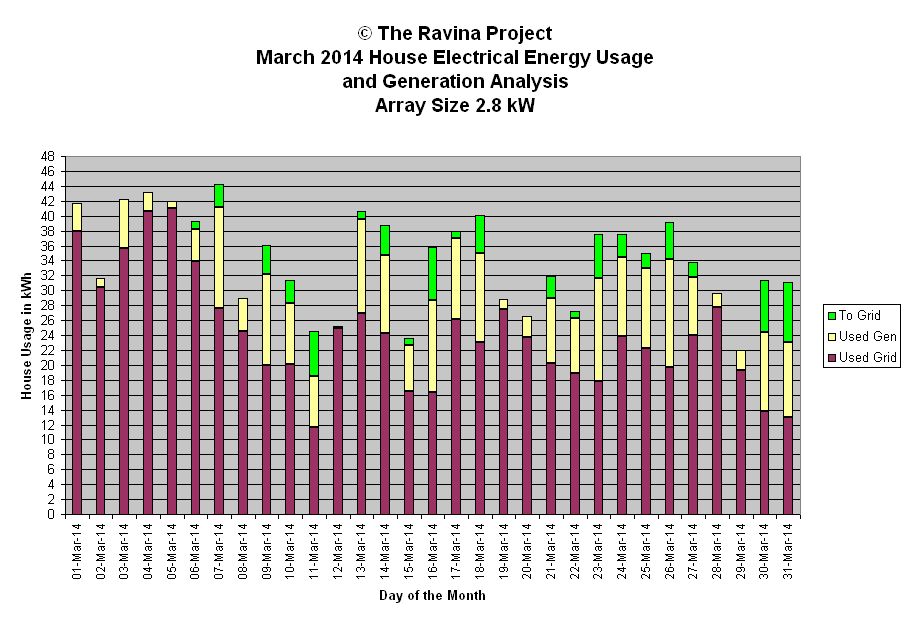
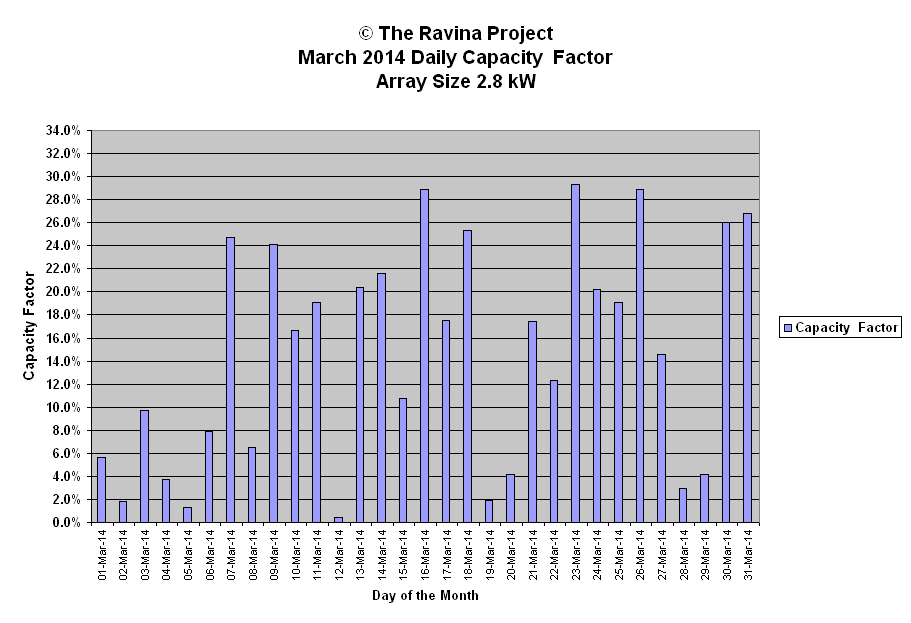
This page contains both generation data and a graph for the month.
Used Gen and Used Grid amounts in the chart show electrical energy used by the household from the solar array and the grid respectively. The To Grid amount represents the energy pushed back to the grid and not used by the household.
| March 2014 Energy Generation Analysis | © The Ravina Project | |||||||||
| Day | kWh | Weather | Peak | Minutes | Efficiency | Capacity | Array Size | 2.8 | kW | |
| Gen | Watts | Wh/min/kW | Factor | |||||||
| 1-Mar-14 | 3.8 | br diff oc dull | 2075 | 674 | 2.0 | 5.7% | Generation Analysis kWh | |||
| 2-Mar-14 | 1.2 | br diff AM psun PM SOA | 425 | 676 | 0.6 | 1.8% | ||||
| 3-Mar-14 | 6.5 | psun soa | 1227 | 679 | 3.4 | 9.7% | Total | 305.0 | ||
| 4-Mar-14 | 2.5 | sun am pt sun pm | 812 | 683 | 1.3 | 3.7% | Average | 9.8 | ||
| 5-Mar-14 | 0.9 | Thn cld soa | 480 | 686 | 0.5 | 1.3% | Median | 11.2 | ||
| 6-Mar-14 | 5.3 | psun soa | 1727 | 688 | 2.8 | 7.9% | Stdev | 6.5 | ||
| 7-Mar-14 | 16.6 | sun | 2734 | 691 | 8.6 | 24.7% | ||||
| 8-Mar-14 | 4.4 | diff am sun pm | 3007 | 695 | 2.3 | 6.5% | WX short forms used | |||
| 9-Mar-14 | 16.2 | sun am thn cld pm | 2858 | 698 | 8.3 | 24.1% | SOA - snow on array | |||
| 10-Mar-14 | 11.2 | sun thn cld mix | 3018 | 700 | 5.7 | 16.7% | oc - overcast | |||
| 11-Mar-14 | 12.8 | sun / thn cld | 2777 | 703 | 6.5 | 19.0% | diff - diffuse light | |||
| 12-Mar-14 | 0.3 | oc snow soa | 83 | 707 | 0.2 | 0.4% | brks - breaks | |||
| 13-Mar-14 | 13.7 | soa am psun | 2454 | 710 | 6.9 | 20.4% | br - bright | |||
| 14-Mar-14 | 14.5 | thn cld / sun mix | 2985 | 712 | 7.3 | 21.6% | cld - cloud | |||
| 15-Mar-14 | 7.2 | sun cld mix | 3514 | 715 | 3.6 | 10.7% | hi - high altitude | |||
| 16-Mar-14 | 19.4 | cold psun cld brks | 3069 | 719 | 9.6 | 28.9% | psun - pristine sun | |||
| 17-Mar-14 | 11.8 | thn cld am psun pm | 3418 | 722 | 5.8 | 17.6% | pds - periods | |||
| 18-Mar-14 | 17.0 | thn cld am sun pm cold | 3211 | 725 | 8.4 | 25.3% | pt - part | |||
| 19-Mar-14 | 1.3 | oc dull rain | 484 | 727 | 0.6 | 1.9% | wx - weather | |||
| 20-Mar-14 | 2.8 | oc dull windy | 925 | 731 | 1.4 | 4.2% | sml - small | |||
| 21-Mar-14 | 11.7 | psun am sun pm | 3169 | 734 | 5.7 | 17.4% | mod - moderate | |||
| 22-Mar-14 | 8.3 | sun cld oc mix | 3297 | 737 | 4.0 | 12.4% | ||||
| 23-Mar-14 | 19.7 | sun cold -5C | 2985 | 740 | 9.5 | 29.3% | Peak Watt Analysis W | |||
| 24-Mar-14 | 13.6 | sun cld mix cld | 3483 | 743 | 6.5 | 20.2% | ||||
| 25-Mar-14 | 12.8 | milky sky cold | 2854 | 746 | 6.1 | 19.0% | Maximum | 3514 | ||
| 26-Mar-14 | 19.4 | sun | 3374 | 749 | 9.3 | 28.9% | Minimum | 83 | ||
| 27-Mar-14 | 9.8 | sun/cld/oc mix cold | 2464 | 752 | 4.7 | 14.6% | Average | 2297 | ||
| 28-Mar-14 | 2.0 | oc dull sun brk | 2455 | 755 | 0.9 | 3.0% | Median | 2734 | ||
| 29-Mar-14 | 2.8 | oc dull | 571 | 758 | 1.3 | 4.2% | Std deviation | 1086 | ||
| 30-Mar-14 | 17.5 | sun thn cld am | 2617 | 761 | 8.2 | 26.0% | ||||
| 31-Mar-14 | 18.0 | psun | 2644 | 764 | 8.4 | 26.8% | Efficiency Analysis Wh/min/kW | |||
| Monthly: | 305.0 | 22280 | Capacity Factor Analysis | Maximum | 9.6 | |||||
| YTD: | 699.3 | Minimum | 0.2 | |||||||
| High | 29.3% | Average | 4.9 | |||||||
| Low | 0.4% | Median | 5.7 | |||||||
| Average | 14.6% | Std Deviation | 3.2 | |||||||
| Median | 16.7% | |||||||||
| Std Dev | 9.6% | |||||||||


