|
|
|
|
Solar Data October 2013
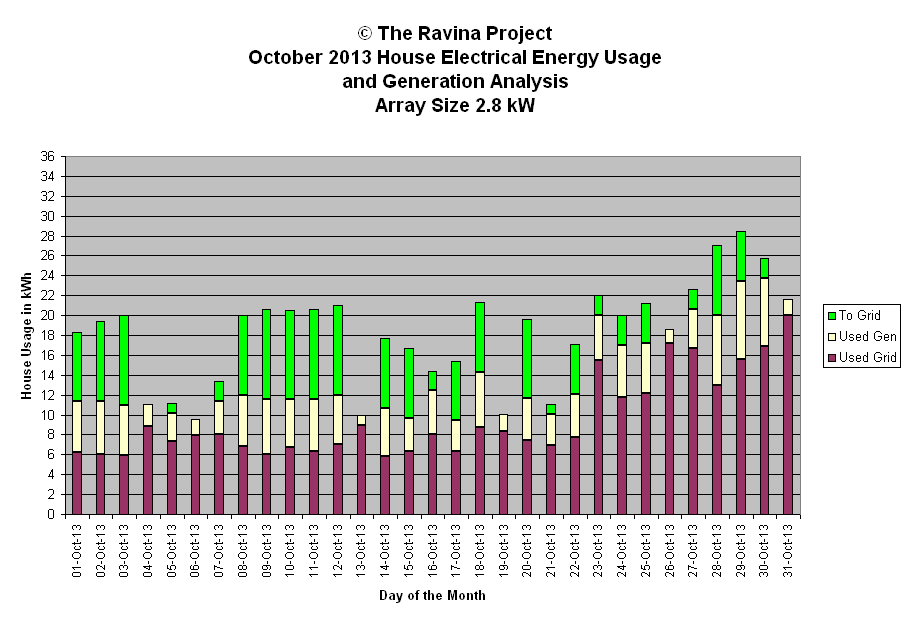
This page contains both generation data and a graph for the month.
Used Gen and Used Grid amounts in the chart show electrical energy used by the household from the solar array and the grid respectively. The To Grid amount represents the energy pushed back to the grid and not used by the household. Super storm Sandy's effects are apparent over the last 9 days of the month. Lots of cloud.
| October 2013 Energy Generation Analysis | © The Ravina Project | ||||||||
| Day | kWh | Weather | Peak | Minutes | Efficiency | Array Size | 2.8 | kW | |
| Gen | Watts | Wh/min/kW | |||||||
| 1-Oct-13 | 12.1 | sun hz thn cld | 2882 | 702 | 6.2 | Generation Analysis kWh | |||
| 2-Oct-13 | 13.4 | sun hz AM sun PM | 2684 | 699 | 6.8 | ||||
| 3-Oct-13 | 14.1 | sun thn cld AM sun PM | 2806 | 696 | 7.2 | Total | 269.4 | ||
| 4-Oct-13 | 2.2 | cld rain | 953 | 693 | 1.1 | Average | 8.9 | ||
| 5-Oct-13 | 3.9 | cld oc diffuse mix | 997 | 691 | 2.0 | Median | 9.2 | ||
| 6-Oct-13 | 1.6 | oc dull rain | 480 | 688 | 0.8 | Stdev | 4.6 | ||
| 7-Oct-13 | 5.3 | sun cld mix | 2959 | 684 | 2.8 | ||||
| 8-Oct-13 | 13.1 | sun cld mix | 3022 | 681 | 6.9 | WX short forms used | |||
| 9-Oct-13 | 14.5 | Pristine sun | 2519 | 679 | 7.6 | ||||
| 10-Oct-13 | 13.8 | wispy cld sun mix | 2572 | 676 | 7.3 | oc - overcast | |||
| 11-Oct-13 | 14.3 | pristine sun | 2521 | 673 | 7.6 | diff - diffuse light | |||
| 12-Oct-13 | 14.0 | pristine sun cld mix | 2692 | 669 | 7.5 | brks - breaks | |||
| 13-Oct-13 | 1.0 | oc rain dull | 433 | 667 | 0.5 | br - bright | |||
| 14-Oct-13 | 11.8 | psun AM pt cld PM | 2910 | 664 | 6.3 | cld - cloud | |||
| 15-Oct-13 | 10.3 | sun cld mix | 3246 | 661 | 5.6 | psun - pristine sun | |||
| 16-Oct-13 | 6.4 | sun cld rain mix | 2797 | 658 | 3.5 | hz - haze pollution or cirrus | |||
| 17-Oct-13 | 9.1 | sun cld mix | 3372 | 655 | 5.0 | pds - periods | |||
| 18-Oct-13 | 12.5 | sun AM sun cld mix PM | 2802 | 652 | 6.8 | pt - part | |||
| 19-Oct-13 | 1.8 | rain oc | 732 | 650 | 1.0 | wx - weather | |||
| 20-Oct-13 | 12.2 | sun cld brks | 2822 | 646 | 6.7 | sml - small | |||
| 21-Oct-13 | 4.1 | thn cld oc | 1172 | 644 | 2.3 | mod - moderate | |||
| 22-Oct-13 | 9.3 | sun AM cld PM | 3403 | 641 | 5.2 | ||||
| 23-Oct-13 | 6.5 | sun AM cld PM | 3394 | 639 | 3.6 | Peak Watt Analysis W | |||
| 24-Oct-13 | 8.2 | sun cld mix | 3473 | 635 | 4.6 | ||||
| 25-Oct-13 | 9.1 | sun cld mix | 3432 | 632 | 5.1 | Maximum | 3473 | ||
| 26-Oct-13 | 1.4 | dull oc rain | 1438 | 630 | 0.8 | Minimum | 433 | ||
| 27-Oct-13 | 5.9 | sun cld oc mix | 3229 | 627 | 3.4 | Average | 2491 | ||
| 28-Oct-13 | 14.1 | sun thn cld | 2832 | 624 | 8.1 | Median | 2804 | ||
| 29-Oct-13 | 12.9 | sun thn cld | 3352 | 622 | 7.4 | Std deviation | 955 | ||
| 30-Oct-13 | 8.9 | sun cld mix | 2802 | 619 | 5.1 | ||||
| 31-Oct-13 | 1.6 | oc rain | 673 | 616 | 0.9 | Efficiency Analysis Wh/min/kW | |||
| Monthly: | 269.4 | 20413 | Maximum | 8.1 | |||||
| YTD: | 1385.9 | Minimum | 0.5 | ||||||
| Average | 4.8 | ||||||||
| Median | 5.2 | ||||||||
| Std Deviation | 2.5 | ||||||||

