|
|
|
|
Solar Data September 2007
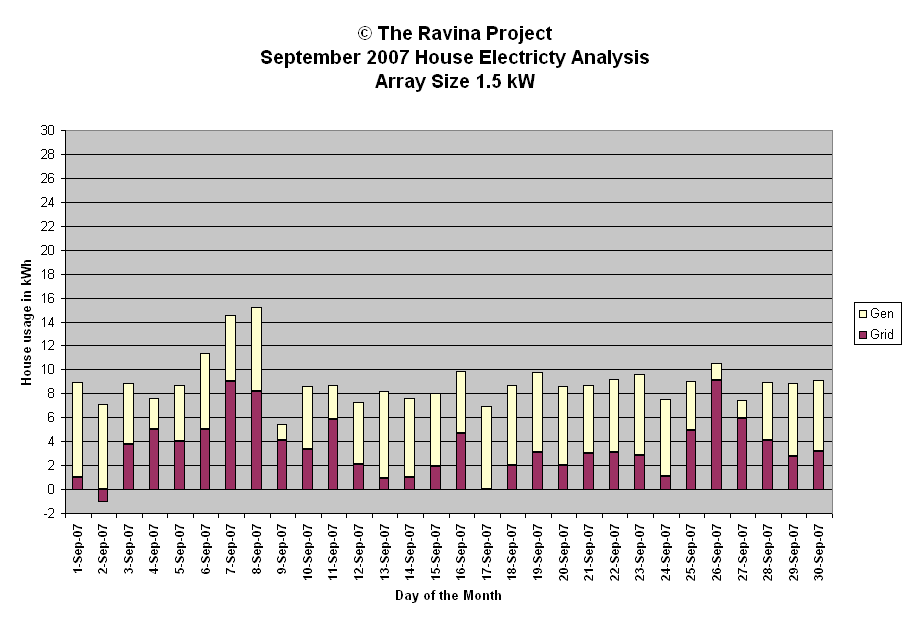
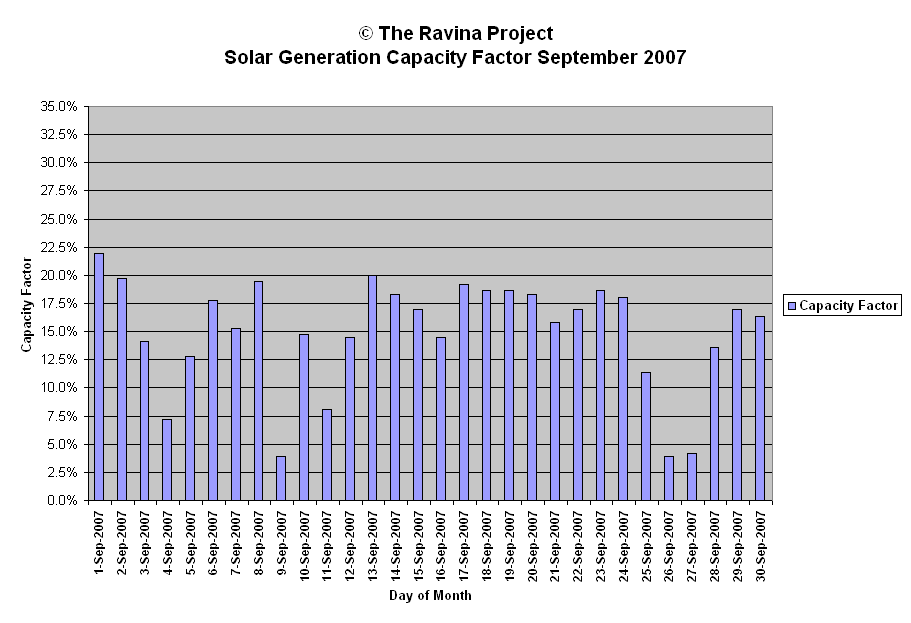
This page contains the daily generation data, a graph of the breakout between generated energy and Grid energy used plus a graphic of the daily Capacity Factor.
Date kWh Gen Weather Peak Minutes Efficiency Capacity Array Size 1.5 Watts in Day Wh/min/kW Factor Generation Analysis kWh 1-Sep-2007 7.9 Pristine Sun 1128 798 6.6 21.9% 2-Sep-2007 7.1 Pristine Sun 1076 795 6.0 19.7% Total 161.9 3-Sep-2007 5.1 cld am sun pm 1272 792 4.3 14.2% Maximum 7.9 4-Sep-2007 2.6 cld oc 1027 790 2.2 7.2% Minimum 1.4 5-Sep-2007 4.6 cld am sun pm 1155 787 3.9 12.8% Average 5.4 6-Sep-2007 6.4 sun smog 999 784 5.4 17.8% Median 6.0 7-Sep-2007 5.5 sun smog cld pm 1000 780 4.7 15.3% Std Deviation 1.8 8-Sep-2007 7.0 Pristine Sun 1076 777 6.0 19.4% 9-Sep-2007 1.4 oc dull 1320 775 1.2 3.9% WX short forms used 10-Sep-2007 5.3 diff am sun pm 1215 772 4.6 14.7% 11-Sep-2007 2.9 pt sun 1512 769 2.5 8.1% oc - overcast 12-Sep-2007 5.2 pt sun 1519 766 4.5 14.4% diff - diffuse light 13-Sep-2007 7.2 sun 1117 763 6.3 20.0% brks - breaks 14-Sep-2007 6.6 sun am pm late cld rain 1074 761 5.8 18.3% SOA - snow on array 15-Sep-2007 6.1 pt cld 1715 757 5.4 16.9% cld - cloud 16-Sep-2007 5.2 diff oc am sun late pm 1612 754 4.6 14.4% psun - Pristine Sun 17-Sep-2007 6.9 Pristine Sun 1137 751 6.1 19.2% hz - haze, pollution or cirrus 18-Sep-2007 6.7 sun 1087 748 6.0 18.6% pds - periods 19-Sep-2007 6.7 sun smog hz 1047 745 6.0 18.6% pt - part 20-Sep-2007 6.6 Pristine Sun 1071 742 5.9 18.3% wx - weather 21-Sep-2007 5.7 sun hz cld 1068 740 5.1 15.8% thn - thin 22-Sep-2007 6.1 sun pristine little cld 1308 737 5.5 16.9% l8r - later 23-Sep-2007 6.7 Pristine Sun 1077 733 6.1 18.6% 24-Sep-2007 6.5 Pristine Sun 1077 730 5.9 18.1% Peak Watt Analysis W 25-Sep-2007 4.1 pt cld 1117 727 3.8 11.4% 26-Sep-2007 1.4 cld rain oc 1000 724 1.3 3.9% Maximum 1715 27-Sep-2007 1.5 cld rain oc 727 722 1.4 4.2% Minimum 727 28-Sep-2007 4.9 pt cld rain 1348 719 4.5 13.6% Average 1182 29-Sep-2007 6.1 sun pristine little cld 1493 716 5.7 16.9% Median 1107 30-Sep-2007 5.9 sun mod cirrus 1096 712 5.5 16.4% Std deviation 213 Capacity Factor Analysis Efficiency Analysis Wh/min/kW Monthly: 161.9 22666 YTD: 1407.5 214388 Maximum 21.9% Maximum 6.6 Minimum 3.9% Minimum 1.2 Average 15.0% Average 4.8 Median 16.7% Median 5.4 Std Dev 5.0% Std Deviation 1.6


