|
|
|
|
Solar Data April 2015
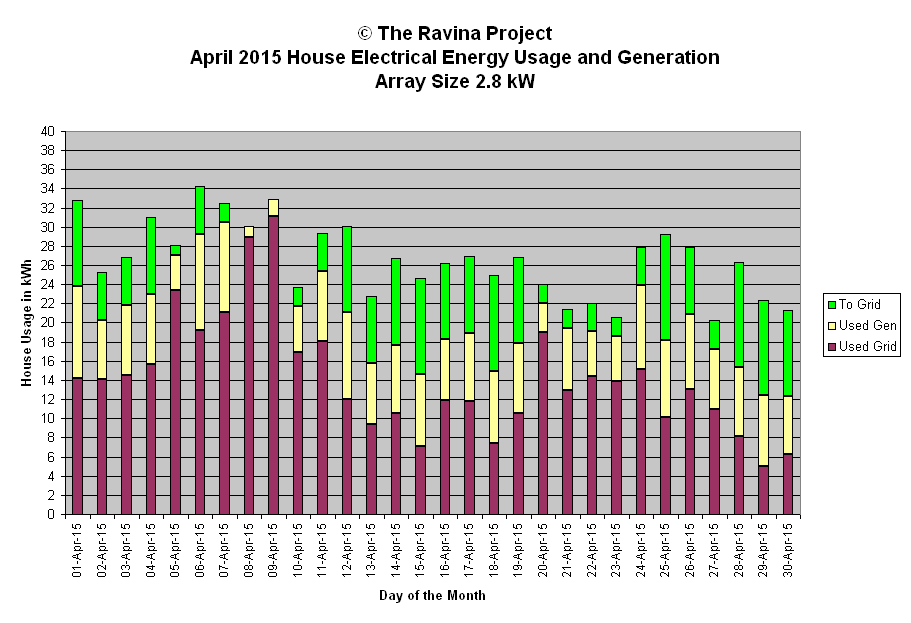
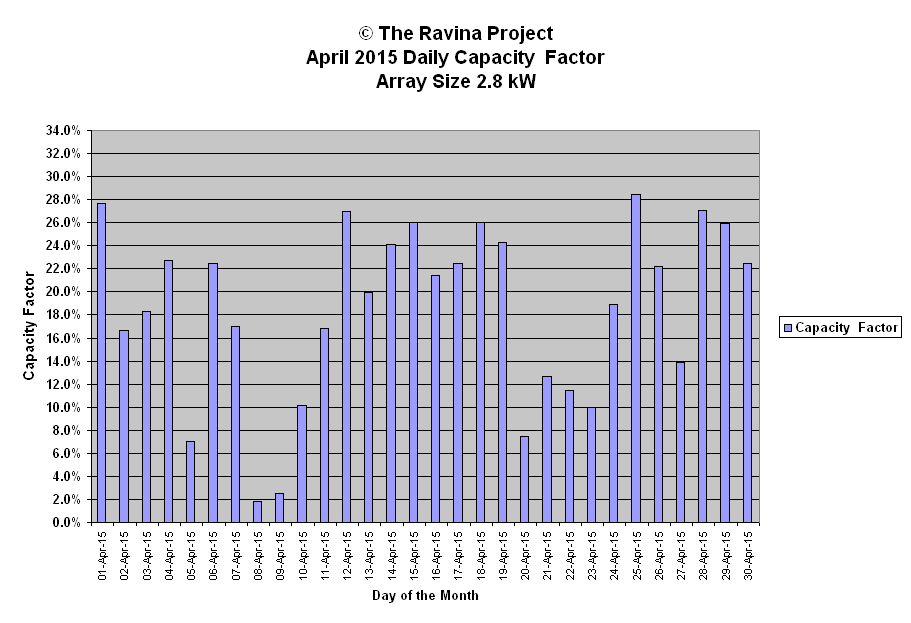
This page contains both generation data and a graph for the month.
Used Gen and Used Grid amounts in the chart show electrical energy used by the household from the solar array and the grid respectively. The To Grid amount represents the energy pushed back to the grid and not used by the household.
| April 2015 Energy Generation Analysis | © The Ravina Project | |||||||||
| Day | kWh | Weather | Peak | Minutes | Efficiency | Capacity | Array Size | 2.8 | kW | |
| Gen | Watts | Wh/min/kW | Factor | |||||||
| 1-Apr-15 | 18.6 | sun | 2753 | 767 | 8.7 | 27.7% | Generation Analysis kWh | |||
| 2-Apr-15 | 11.2 | sun am pt cld pm | 2836 | 770 | 5.2 | 16.7% | ||||
| 3-Apr-15 | 12.3 | sun am thn cld pm | 2858 | 772 | 5.7 | 18.3% | Total | 372.7 | ||
| 4-Apr-15 | 15.3 | sun am cld pm | 3507 | 776 | 7.0 | 22.8% | Average | 12.4 | ||
| 5-Apr-15 | 4.7 | cld snow | 1542 | 779 | 2.2 | 7.0% | Median | 13.9 | ||
| 6-Apr-15 | 15.1 | cld am sun pm | 2902 | 782 | 6.9 | 22.5% | Stdev | 5.1 | ||
| 7-Apr-15 | 11.4 | cld sun brks | 3063 | 785 | 5.2 | 17.0% | ||||
| 8-Apr-15 | 1.2 | oc rain | 432 | 787 | 0.5 | 1.8% | WX short forms used | |||
| 9-Apr-15 | 1.7 | oc rain | 528 | 791 | 0.8 | 2.5% | ||||
| 10-Apr-15 | 6.8 | cld pt cun | 3437 | 794 | 3.1 | 10.1% | oc - overcast | |||
| 11-Apr-15 | 11.3 | cld am sun pm | 3637 | 796 | 5.1 | 16.8% | diff - diffuse light | |||
| 12-Apr-15 | 18.1 | sun | 2623 | 799 | 8.1 | 26.9% | brks - breaks | |||
| 13-Apr-15 | 13.4 | sun cld brks | 2920 | 802 | 6.0 | 19.9% | br - bright | |||
| 14-Apr-15 | 16.2 | sun am thn cld pm | 2388 | 806 | 7.2 | 24.1% | cld - cloud | |||
| 15-Apr-15 | 17.5 | sun | 2370 | 808 | 7.7 | 26.0% | hi - high altitude | |||
| 16-Apr-15 | 14.4 | sun thn cld mix | 2824 | 811 | 6.3 | 21.4% | hz - haze pollution or cirrus | |||
| 17-Apr-15 | 15.1 | thn cld am sun/cld mix pm | 2363 | 814 | 6.6 | 22.5% | pds - periods | |||
| 18-Apr-15 | 17.5 | sun cld mix am sun pm | 2347 | 816 | 7.7 | 26.0% | pt - part | |||
| 19-Apr-15 | 16.3 | sun cld mix | 2814 | 820 | 7.1 | 24.3% | wx - weather | |||
| 20-Apr-15 | 5.0 | cld rain am sun pm | 3151 | 822 | 2.2 | 7.4% | sml - small | |||
| 21-Apr-15 | 8.5 | sun oc mix rain | 3264 | 825 | 3.7 | 12.6% | mod - moderate | |||
| 22-Apr-15 | 7.7 | sun oc mix | 2986 | 828 | 3.3 | 11.5% | ||||
| 23-Apr-15 | 6.7 | oc sun brks | 3029 | 830 | 2.9 | 10.0% | Peak Watt Analysis W | |||
| 24-Apr-15 | 12.7 | sun cld mix | 3540 | 834 | 5.4 | 18.9% | ||||
| 25-Apr-15 | 19.1 | sun am cld brks pm | 2603 | 836 | 8.2 | 28.4% | Maximum | 3637 | ||
| 26-Apr-15 | 14.9 | sun cld mix | 3265 | 839 | 6.3 | 22.2% | Minimum | 432 | ||
| 27-Apr-15 | 9.3 | cld sun brks | 3308 | 841 | 3.9 | 13.8% | Average | 2715 | ||
| 28-Apr-15 | 18.2 | sun thn cld brks | 2755 | 844 | 7.7 | 27.1% | Median | 2847 | ||
| 29-Apr-15 | 17.4 | sun thn cld am | 2256 | 846 | 7.3 | 25.9% | Std deviation | 755 | ||
| 30-Apr-15 | 15.1 | sun cld mix | 3163 | 850 | 6.3 | 22.5% | ||||
| Efficiency Analysis Wh/min/kW | ||||||||||
| Monthly: | 372.7 | 24270 | Capacity Factor Analysis | |||||||
| YTD: | 1196.7 | Maximum | 8.7 | |||||||
| High | 28.4% | Minimum | 0.5 | |||||||
| Low | 1.8% | Average | 5.5 | |||||||
| Average | 18.5% | Median | 6.2 | |||||||
| Median | 20.7% | Std Deviation | 2.3 | |||||||
| Std Dev | 7.6% | |||||||||


