|
|
|
|
|
|
|
|
|
|
|
|
|
|
|
|
|
|
|
|
|
|
|
|
|
|
|
|
2015 Solar Data Home Page
When you click on any of the buttons to the left you will see a day by day spreadsheet of each month's solar power generation. With each sheet you will be able to see the data in a graph format.
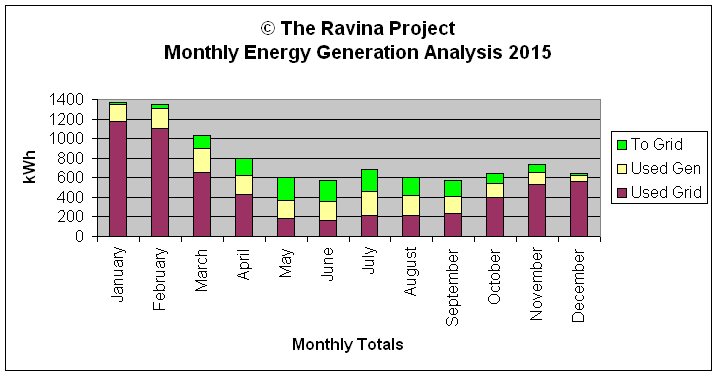
Below see the year to date at a glance. Gen means energy generated by solar. Used Grid means energy used from the grid. Used Gen is the generated energy used by the household. % Gen is the electricity generated each month as a percent of the household's total monthly electrical energy usage. To Grid means the amount of our generated energy we sent to the grid. The % Gen number will always be lower than the one on the Solar Data Home page. The number on this page is calculated Net of the To Grid number.
We upgraded our array from 1.5 kW to 2.8 kW on September 18th, 2013.
Year 2015 Monthly kWh Analysis
| Month | Gen | Used Grid | Used Gen | % Gen | To Grid | |
| January | 199.7 | 1173.2 | 173.7 | 12.9 | 26.0 | |
| February | 246.8 | 1105.8 | 204.8 | 15.6 | 42.0 | |
| March | 377.5 | 658.7 | 242.5 | 26.9 | 135.0 | |
| April | 372.7 | 426.8 | 197.7 | 31.7 | 175.0 | |
| May | 420.7 | 179.0 | 188.7 | 51.3 | 232.0 | |
| June | 410.0 | 166.9 | 193.0 | 53.6 | 217.0 | |
| July | 476.9 | 210.0 | 254.9 | 54.8 | 222.0 | |
| August | 392.0 | 210.4 | 213.0 | 50.3 | 179.0 | |
| September | 329.7 | 238.4 | 167.7 | 41.3 | 162.0 | |
| October | 248.7 | 398.9 | 140.7 | 26.1 | 108.0 | |
| November | 195.8 | 535.8 | 122.8 | 18.6 | 73.0 | |
| December | 80.9 | 564.8 | 58.9 | 9.4 | 22.0 | |
| Total: | 3751.4 | 5868.7 | 2158.4 | 26.9 | 1593.0 |

Year 2015 Monthly Capacity Factor Analysis
| Minimum | Maximum | Average | Median | Std Dev | ||
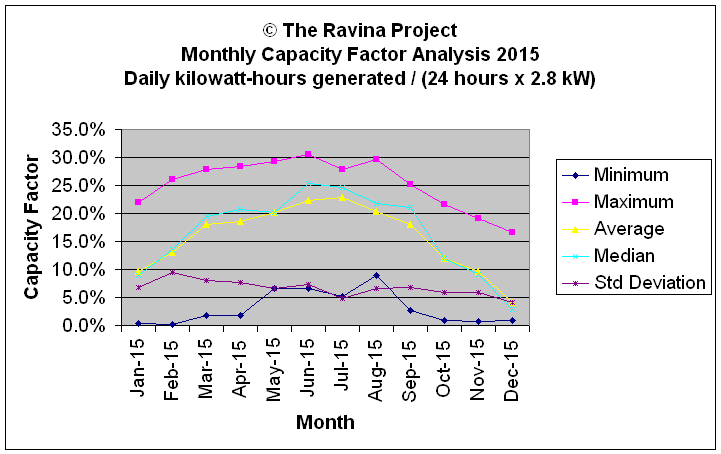
| Jan-15 | 0.3% | 22.0% | 9.6% | 8.9% | 6.8% | |
| Feb-15 | 0.1% | 26.0% | 13.1% | 13.5% | 9.5% | |
| Mar-15 | 1.8% | 27.8% | 18.1% | 19.5% | 8.1% | |
| Apr-15 | 1.8% | 28.4% | 18.5% | 20.7% | 7.6% | |
| May-15 | 6.5% | 29.3% | 20.2% | 20.2% | 6.5% | |
| Jun-15 | 6.7% | 30.5% | 22.4% | 25.3% | 7.4% | |
| Jul-15 | 5.2% | 27.8% | 22.9% | 24.7% | 4.9% | |
| Aug-15 | 9.0% | 29.6% | 20.3% | 21.9% | 6.6% | |
| Sep-15 | 2.7% | 25.2% | 18.0% | 21.1% | 6.9% | |
| Oct-15 | 0.9% | 21.6% | 11.9% | 11.9% | 5.9% | |
| Nov-15 | 0.7% | 19.0% | 9.7% | 9.2% | 5.9% | |
| Dec-15 | 0.9% | 16.7% | 4.2% | 2.8% | 4.1% |

Year 2015 Monthly Peak Watt Analysis
| Minimum | Maximum | Average | Median | Std Deviation | ||
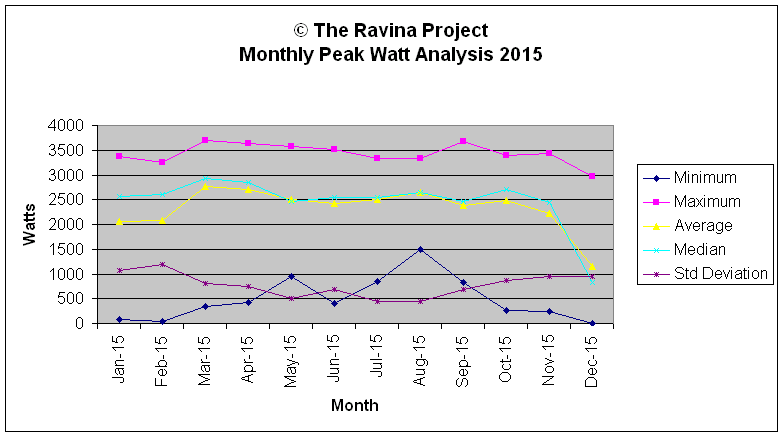
| Jan-15 | 71 | 3382 | 2062 | 2570 | 1067 | |
| Feb-15 | 49 | 3252 | 2071 | 2598 | 1188 | |
| Mar-15 | 348 | 3705 | 2778 | 2935 | 803 | |
| Apr-15 | 432 | 3637 | 2715 | 2847 | 755 | |
| May-15 | 952 | 3584 | 2497 | 2473 | 504 | |
| Jun-15 | 411 | 3521 | 2428 | 2541 | 695 | |
| Jul-15 | 847 | 3335 | 2499 | 2540 | 450 | |
| Aug-15 | 1503 | 3330 | 2640 | 2637 | 454 | |
| Sep-15 | 819 | 3672 | 2393 | 2462 | 687 | |
| Oct-15 | 271 | 3392 | 2479 | 2704 | 865 | |
| Nov-15 | 233 | 3435 | 2226 | 2446 | 953 | |
| Dec-15 | 0 | 2964 | 1160 | 826 | 950 |

Monthly 2015 Efficiency Analysis
| Minimum | Maximum | Average | Median | Std Dev | ||
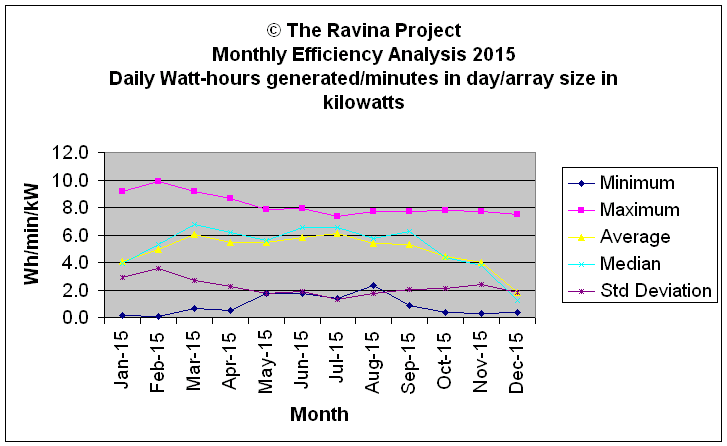
| Jan-15 | 0.1 | 9.2 | 4.1 | 3.9 | 2.9 | |
| Feb-15 | 0.1 | 9.9 | 5.0 | 5.3 | 3.5 | |
| Mar-15 | 0.6 | 9.1 | 6.0 | 6.8 | 2.7 | |
| Apr-15 | 0.5 | 8.7 | 5.5 | 6.2 | 2.3 | |
| May-15 | 1.7 | 7.9 | 5.5 | 5.6 | 1.8 | |
| Jun-15 | 1.7 | 7.9 | 5.8 | 6.5 | 1.9 | |
| Jul-15 | 1.4 | 7.4 | 6.1 | 6.5 | 1.3 | |
| Aug-15 | 2.4 | 7.7 | 5.4 | 5.8 | 1.7 | |
| Sep-15 | 0.9 | 7.7 | 5.3 | 6.2 | 2.0 | |
| Oct-15 | 0.3 | 7.8 | 4.4 | 4.4 | 2.1 | |
| Nov-15 | 0.3 | 7.7 | 4.0 | 3.8 | 2.4 | |
| Dec-15 | 0.4 | 7.5 | 1.9 | 1.2 | 1.8 |
