|
|
|
|
|
|
|
|
|
|
|
|
|
|
|
|
|
|
|
|
|
|
|
|
|
|
|
|
2010 Solar Data Home Page
When you click on any of the buttons to the left you will see a day by day spreadsheet of each month's solar power generation. With each sheet you will be able to see the data in a graph format.
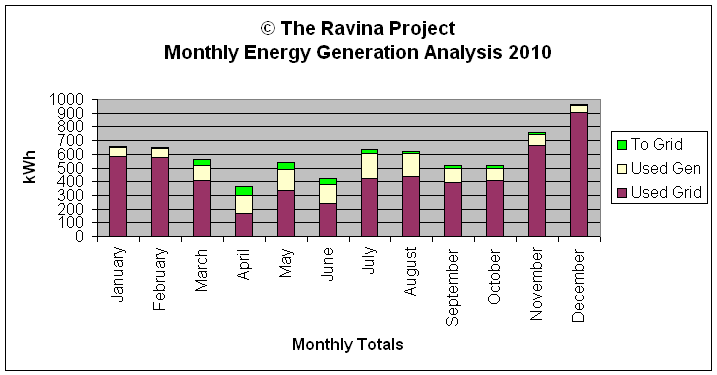
Below see the year to date at a glance. Gen means energy generated by solar. Used Grid means energy used from the grid. Used Gen is the generated energy used by the household. % Gen is the electricity generated each month as a percent of the household's total monthly electrical energy usage. To Grid means the amount of our generated energy we sent to the grid. The % Gen number will always be lower than the one on the Solar Data Home page. The number on this page is calculated Net of the To Grid number.
Yearly 2010 totals and other stats: yearly solar generation efficiency 4.2 wh/min/kW total solar generation per kW of collector 1116.9 kWh/kW average solar energy generation per day 4.6 kWh/day total electrical energy generation 1675.4 kWh total grid energy used 5544.3 kWh Total energy sent back to grid 333.0 kWh percentage of total energy generated 23.2% House total electrical energy consumption 7219.7 kWh total gas used 2349.0 cubic meters yearly average gas usage / day 6.4 cubic meters average gas usage / day for heating 6.5 cubic meters total yearly energy consumption from all sources 31.5 mWh house efficiency - cm used per HDD 0.48 cubic meters
Year 2010 Monthly kWh Analysis
| Month | Gen | Used Grid | Used Gen | % Gen | To Grid | |
| January | 71.9 | 587.1 | 62.9 | 11.1 | 9.0 | |
| February | 77.2 | 575.3 | 67.2 | 12.0 | 10.0 | |
| March | 157.8 | 407.5 | 112.8 | 30.3 | 45.0 | |
| April | 198.7 | 164.6 | 131.7 | 67.1 | 67.0 | |
| May | 204.4 | 336.1 | 155.4 | 41.6 | 49.0 | |
| June | 182.3 | 240.0 | 138.3 | 48.2 | 44.0 | |
| July | 212.5 | 424.0 | 183.5 | 35.0 | 29.0 | |
| August | 183.9 | 439.9 | 166.9 | 30.3 | 17.0 | |
| September | 123.2 | 394.5 | 101.2 | 24.9 | 22.0 | |
| October | 109.7 | 409.2 | 83.7 | 22.3 | 26.0 | |
| November | 96.6 | 660.8 | 84.6 | 13.0 | 12.0 | |
| December | 57.2 | 905.4 | 54.2 | 6.0 | 3.0 | |
| Total: | 1675.4 | 5544.3 | 1342.4 | 24.3 | 333.0 |

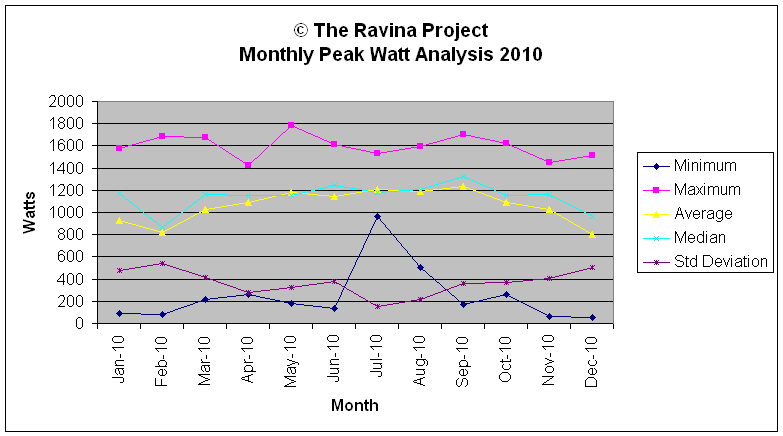
Year 2010 Monthly Peak Watt Analysis
| Minimum | Maximum | Average | Median | Std Deviation | |||
| Jan-10 | 93 | 1578 | 929 | 1175 | 475 | ||
| Feb-10 | 82 | 1686 | 824 | 864 | 536 | ||
| Mar-10 | 215 | 1677 | 1030 | 1165 | 410 | ||
| Apr-10 | 263 | 1427 | 1093 | 1158 | 278 | ||
| May-10 | 183 | 1784 | 1176 | 1154 | 326 | ||
| Jun-10 | 136 | 1609 | 1145 | 1247 | 374 | ||
| Jul-10 | 964 | 1530 | 1207 | 1184 | 151 | ||
| Aug-10 | 501 | 1593 | 1186 | 1209 | 216 | ||
| Sep-10 | 167 | 1707 | 1231 | 1326 | 364 | ||
| Oct-10 | 257 | 1624 | 1091 | 1154 | 369 | ||
| Nov-10 | 60 | 1446 | 1026 | 1163 | 408 | ||
| Dec-10 | 54 | 1512 | 802 | 967 | 504 |

Monthly 2010 Efficiency Analysis
| Minimum | Maximum | Average | Median | Std Dev | |||
| Jan-10 | 0.2 | 7.7 | 2.7 | 1.9 | 1.9 | ||
| Feb-10 | 0.3 | 7.9 | 2.9 | 1.5 | 2.6 | ||
| Mar-10 | 0.7 | 7.9 | 4.7 | 5.7 | 2.6 | ||
| Apr-10 | 0.7 | 7.6 | 5.4 | 6.4 | 2.2 | ||
| May-10 | 1.5 | 7.1 | 5.0 | 5.7 | 1.7 | ||
| Jun-10 | 0.7 | 7.0 | 4.4 | 4.9 | 2.0 | ||
| Jul-10 | 1.0 | 6.6 | 5.1 | 5.5 | 1.5 | ||
| Aug-10 | 1.1 | 6.4 | 4.7 | 5.1 | 1.6 | ||
| Sep-10 | 0.3 | 6.0 | 3.6 | 3.7 | 1.6 | ||
| Oct-10 | 0.7 | 6.6 | 3.6 | 3.3 | 2.1 | ||
| Nov-10 | 0.1 | 7.0 | 3.7 | 3.8 | 2.5 | ||
| Dec-10 | 0.0 | 6.8 | 2.3 | 1.4 | 2.1 |
